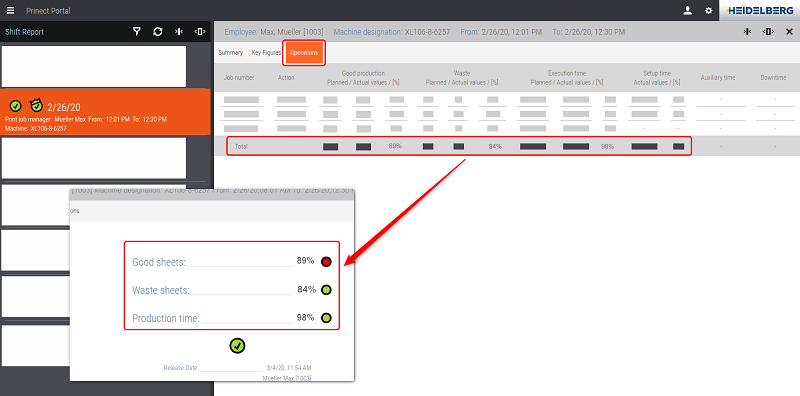
This is where the key performance indicators (KPIs) of a shift display: good sheets, waste sheets and production time. The print job manager/pressroom manager can check the shift at a glance and approve it.
The values are average values resulting from the processed operations of the shift. For details about checking the values, see "Key Figures" Tab and "Operations" Tab.
Rating of the KPIs
The average values achieved (in percent) are rated as green, orange or red, with green being the best result.
The percentages are rated as follows:
|
Key Figure |
Rating |
|---|---|
|
Good sheets |
Green: 100% - 105% Orange: 90% - 100% or 105% - 110% Red: <90% or >110% |
|
Waste sheets |
Green: <=100% Orange: >100% - 105% Red: >=105% |
|
Production time |
Green: <=100% Orange: >100% - 105 % Red: >105% |