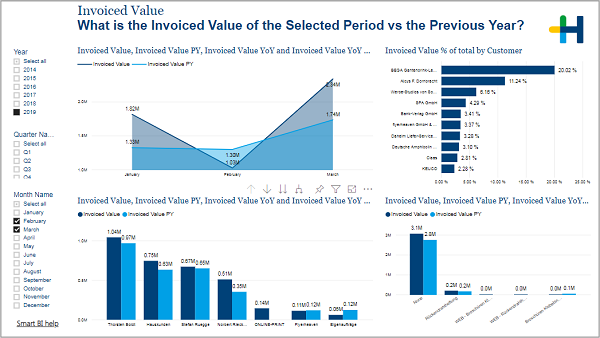
What is the Invoiced Value of the Selected Period vs the Previous Year?
(Change language of this page to: English, Deutsch)
On this page you can see the top customers, representatives and product groups by invoiced value. Furthermore, you can follow the invoiced value throughout the course of the year and find trends for certain months.
The filter area on the left of this page is crucial for the handling of these visuals. If you have not determined a year, then the data for all the visuals is summed over all years. To compare one year with its predecessor you have to select exactly one year.
You can also filter for quarter and month (this won’t affect the first visual that shows invoiced value per month).