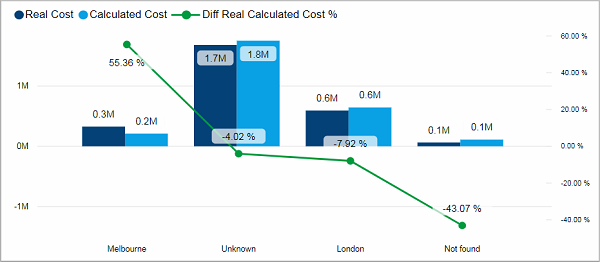
This visual shows a comparison of real and calculated costs for the items of the Cost Category Group 1. The blue bars display the absolute value of the costs and the black line shows the difference in percent.
Facts & Dimensions:
·Y-axis Dark blue [currency]: Real Cost
·Y-axis Light blue [currency]: Calculated Cost
·Y-axis (2nd) Black Line [%]: Diff Real Calculated Cost %
·X-axis: Cost Category Group1
Drillthrough:
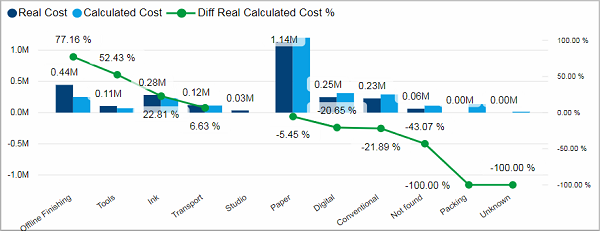
This visual shows a comparison of real and calculated costs for the items of the Cost Category Group 2. The blue bars display the absolute value of the costs and the black line shows the difference in percent.
Facts & Dimensions:
·Y-axis Dark blue [currency]: Real Cost
·Y-axis Light blue [currency]: Calculated Cost
·Y-axis Green Line [%]: Diff Real Calculated Cost %
·X-axis: Cost Category Group2
Drillthrough:
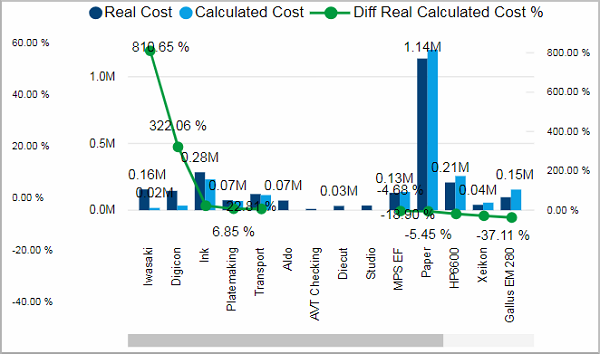
This visual shows a comparison of real and calculated costs for the items of the Cost Category Group 3. The blue bars display the absolute value of the costs and the black line shows the difference in percent.
Facts & Dimensions:
·Y-axis Dark blue [currency]: Real Cost
·Y-axis Light blue [currency]: Calculated Cost
·Y-axis Green Line [%]: Diff Real Calculated Cost %
·X-axis: Cost Category Group3
Drillthrough:
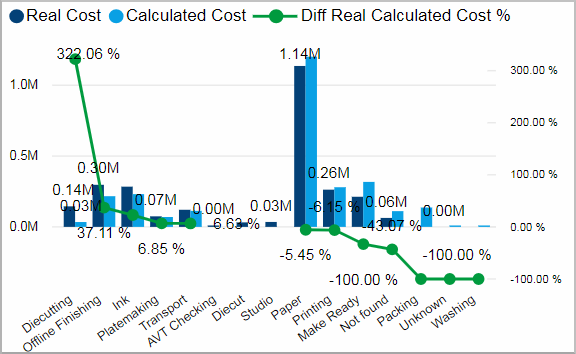
This visual shows a comparison of real and calculated costs for the items of the Cost Category Group 4. The blue bars display the absolute value of the costs and the black line shows the difference in percent.
Facts & Dimensions:
·Y-axis Dark blue [currency]: Real Cost
·Y-axis Light blue [currency]: Calculated Cost
·Y-axis Green Line [%]: Diff Real Calculated Cost %
·X-axis: Cost Category Group4
Drillthrough: