What is the overall Profitability by Calculated Cost and Real Cost?
(Change language of this page to: English, Deutsch)
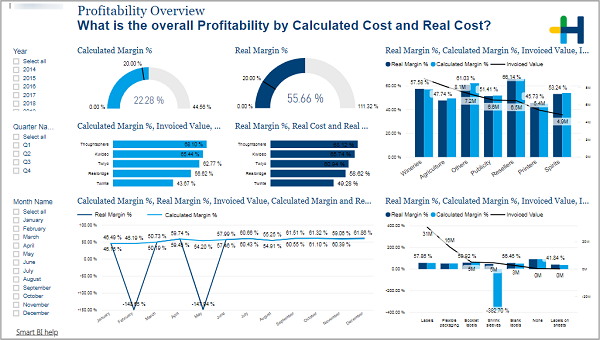
This page gives you an overview of the total real and calculated margins. For example, it can help you to find out how far off the calculations are from the real values.
You can select a time period on the left side.
The two gauge charts show you the Calculated (light blue color) and the Real (dark blue color) margins in percent for your whole production. Below you can see the margins for your top customers.
On the right-hand side you can see both margins for whole customer groups (above) and product groups (below).