What is the On Time in Full (OTIF) per Customer?
(Change language of this page to: English, Deutsch)
This page displays which percentage of your sales was shipped in time and by how much the ordered amount differed from what was actually shipped.
In the filter area on the left you can select the time periods for which the data is displayed. You can select multiple years, quarters and months.
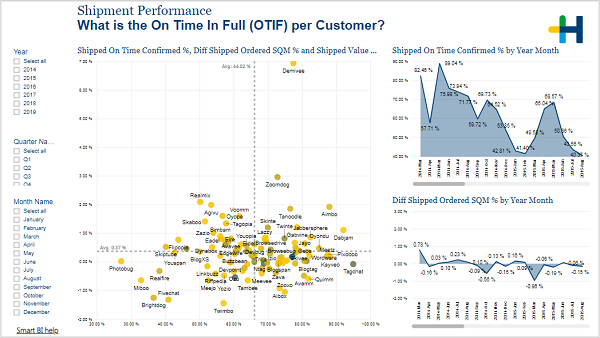
The scatter chart in the middle of the page places each of your customers by what percentage was shipped to them on time on the X-axis and by the difference between shipped and ordered square meters in percent on the Y-axis. Each customer is represented by a dot whose color depends on the sales value. The darker the color the more revenue was created by this customer. The preferred placement for a customer is obviously as far right as possible, because it means that most of the orders were shipped on time, and around the 0% line, which means that the shipped amount didn’t differ too much from the ordered amount. With the help of this chart you can detect outliers. To investigate what went wrong you can use the drillthrough functionality to see the shipment details of this customer or you could left click on this dot. The two visuals on the left side then change to only display the values of this customer.
The upper visual shows you which percentage was shipped on time per each month and the lower visual displays how the shipped amount differed from the ordered amount as well per each month.