General terms in Microsoft Power BI:
•Tile
•App
Terms concerning the data structure:
•Facts (Measures) and Dimensions
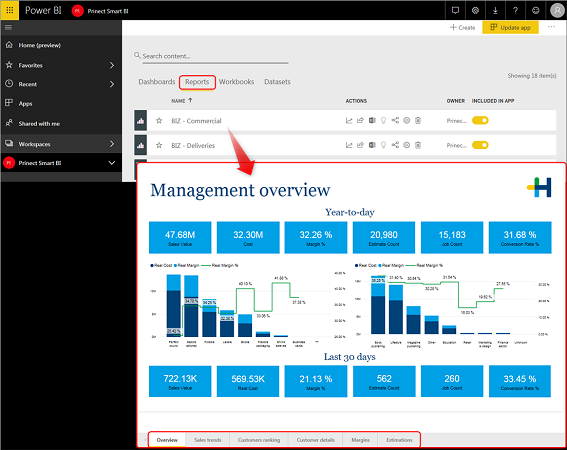
A report offers you a differentiated view into a dataset on one or more pages. Each page gathers a variety of visualizations that represent different findings and insights from that dataset.
See Reports for an in-depth explanation.
The screenshot below shows the report "BIZ - Commercial" with six pages, in this case the "Overview" page.
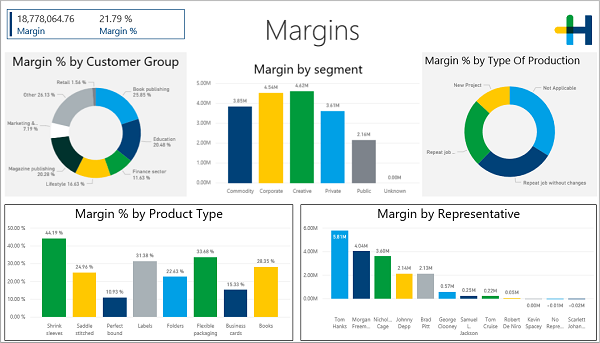
Visualization is a visual display of data, for example, a diagram, a graphic, a color-coded chart, etc. that you can use to visualize your data.
See What sorts of tiles exist? and How can you interact with the visualizations? for further information.
The following diagram shows you various examples of visualization for "Margins".
In Power BI, a tile is a single visualization in a report or dashboard.
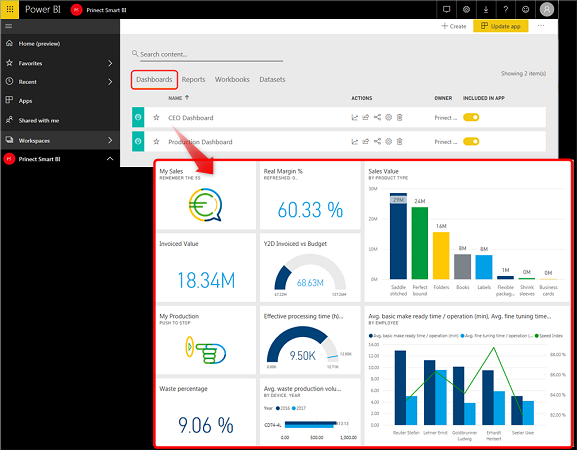
A dashboard compiles the most important visualizations from different reports on one single page.
The example below shows a "CEO Dashboard".
There is a video about this topic:
Video Tutorial: Power of Dashboards
An app is a collection of dashboards and reports built to deliver key metrics for your organization.
The following screenshot shows the "Prinect Smart BI” app.
A dataset is a collection of data that Power BI uses to create visualizations. A dataset can be, for example, a simple Excel table. Datasets can also be a combination of many different sources that you can filter and combine.
Heidelberg supplies several datasets for the visualization of your business and production data:
•Production ("Production")
•Job Costs ("Business")
•Invoices ("Business")
•Invoice Profitability ("Business")
•Sales Order Intake ("Business")
•Job Profitability ("Business")
•Productivity ("Business")
•Profitability ("Business")
Facts (Measures) and Dimensions
Facts (measures) and dimensions are the smallest components in the dataset. They are the data from which queries and diagrams are generated in the end (e.g. order quantity, shipment quantity, good sheets, waste sheets, site, machine, month, customer, etc.).
In this process, facts (measures) are all data that can be measured (order quantity, shipment quantity, good sheets, waste sheets, etc.).
Dimensions are data with which the facts (measures) are grouped (site, machine, month, customer, etc.).
For example, the following queries can be generated from the facts (measures) and dimensions:
•Order quantity of a customer
Waste rate per month and machine
A data warehouse is a database where different data, facts and information arising during running business operations are grouped in a uniform pattern. An internal company data pool emerges as a result which the management can assess for all types of decisions.
Larger companies generally use several databases and database systems for administration of their customer and invoice data, for supervision of their stock and processing of accounting. Usually, large heterogeneous data volumes are produced in this process.
In the data warehouse, these heterogeneous data stocks are grouped in a uniform structure whenever a business process is completed. In this sense, data warehouse is an archive whose information can be accessed fast. In addition, this database can also store information that is not assigned to any business process to start off with but could be of interest at a later point in time for the company.
A data mart is a copy of a subset of data in a data warehouse (DWH) that is created for a certain organizational sector or a certain use or analysis (see below). It can also be understood as a partial view of the data warehouse or non-persistent storage.
Reasons in favor of working with a data mart ("copies" from the data warehouse) instead of direct access to the data in the data warehouse based on views are:
•The need for special data structures (that are not found as such in the DWH) for certain analyses, for example, for multidimensional analysis, known as Online Analytical Processing (OLAP).
•Better performance: Shifting of computer performance to another computer and/or shifting of accesses to another memory and/or, in the case of local use, less network load.
•Independence of the users (e.g. mobility, non-reliance on other organizational sectors). Difference to
•Access protection: Distinction compared to other users or opening for further users (the data in the data warehouse are not accessed directly but only indirectly through the data mart).
•The field of application (subject-specific), the target system (technical) and the users (organizational) can be taken into account through the use of data marts.
The data model of a data mart is often equivalent to a multidimensional or OLAP structure. This data model can be implemented technically as a multidimensional database, as a relational database or increasingly also in the memory of the computer.
A cube (domain) is an analytical database for information. A cube (domain) is also known as an OLAP cube or data cube and is designed for the logical preparation of quantitative data. The data are arranged as elements of a multidimensional cube and generally come from a structured data warehouse or data mart. The dimensions of the cube describe the data and allow easy access. Data can be selected through one or more axes of the cube. The term OLAP (Online Analytical Processing) originates from data analysis.
This kind of display has benefits for the analysis of data because the various aspects (dimensions) of the data are accessed in the same way. That is the reason for its use in OLAP applications that analyze or visually edit the data in a data warehouse.
For example, turnover, stocks and sales can be analyzed. The dimensions that can be important in this case include time, branch, sales assistant and product.
In other words, the cube displays the data (also called facts) for turnover, stock, sales independently of the dimensions period, branch, sales assistant, customer and product.
Consequently, answers to the following questions are easy to find:
How much paper was used last week in the print shop in Marburg?
How much paper is in stock there?
Which sales assistant sold the most?
Which print shop had the biggest turnover last year?