Key factors of waste
(Change language of this page to: English, Deutsch)
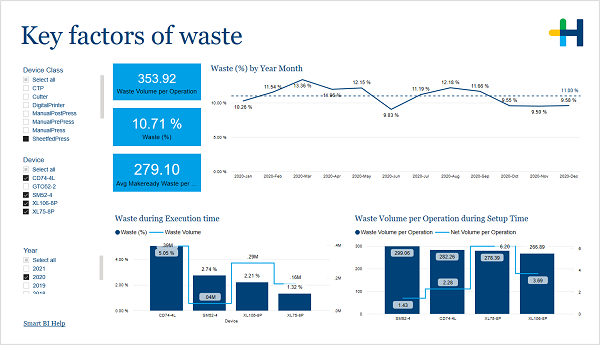
This page shows you the key waste values broken down by devices.
....
The three blue boxes show you the values for:
•Avg Makeready Waste per Operation
The top lone chart shows you the development of the monthly waste percentage.
The two charts below show you the waste during different operational times: execution time and setup time.
In the filter area on the left you can adjust which devices and years are included in the charts.