(Change language of this page to: English, Deutsch)
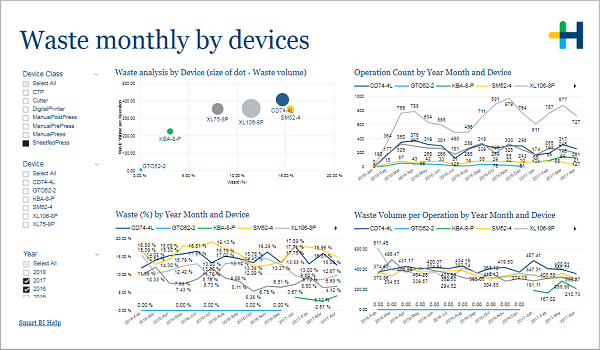
This page helps you to compare waste results between your devices.
....
The first chart places your devices on a waste percentage - waste volume per operation scatter chart. It shows the results for the selected time period.
The other charts show you the number of operations, waste percentage and waste volume per operation by month and by device.
In the filter area on the left you can adjust which devices and years are included in the charts.