•Number of operations by month and device
•Waste percentage by month and device
•Waste volume per operation by month and device
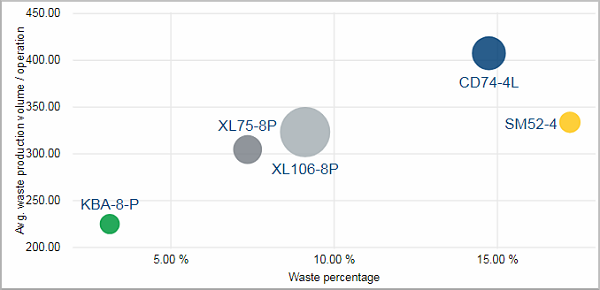
This scatter chart shows the waste percentage on the horizontal axis and the waste volume per operation on the vertical axis. The size of the dot corresponds to the waste volume. The results are calculated for the selected time period.
Facts & Dimensions:
•Y-axis [units]: Waste Volume per Operation
•Dots: Device
•Size by: Waste Volume
•X-axis [%]: Waste (%)
Drillthrough:
Number of operations by month and device
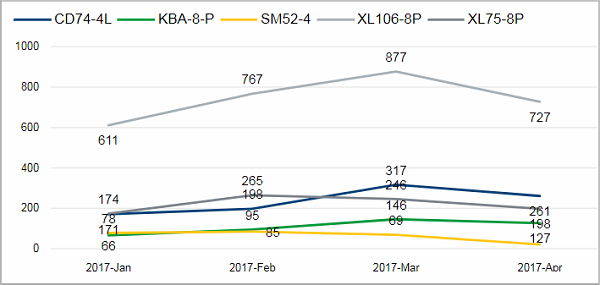
Facts & Dimensions:
•Y-axis: Operation Count
•Colors by: Device
•X-axis [date]: Year Month
Drillthrough:
Waste percentage by month and device
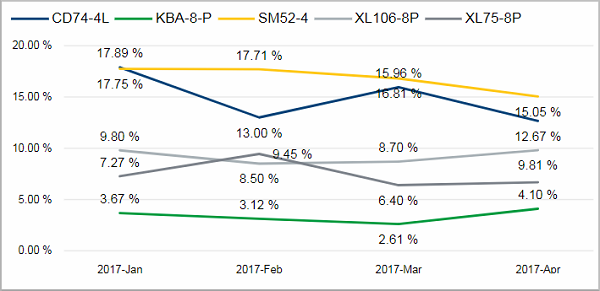
Facts & Dimensions:
•Y-axis: Waste (%)
•Colors by: Device
•X-axis [date]: Year Month
Drillthrough:
Waste volume per operation by month and device
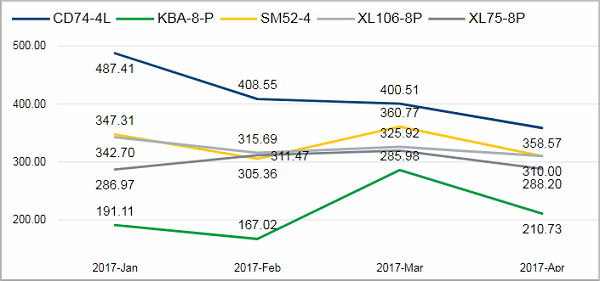
Facts & Dimensions:
•Y-axis [units]: Waste Volume per Operation
•Colors by: Device
•X-axis [date]: Year Month
Drillthrough: