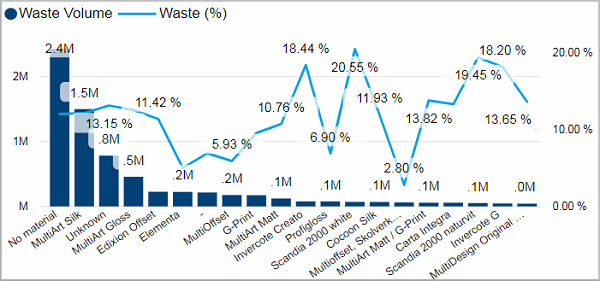
•Worst 20 materials by waste volume
•Waste volume by month and device
•Waste percentage by month and device
Worst 20 materials by waste volume
Facts & Dimensions:
•Y-axis Dark blue [units]: Waste Volume
•Y-axis (2nd) Light blue line [%]: Waste (%)
•X-axis: Material
Waste volume by month and device
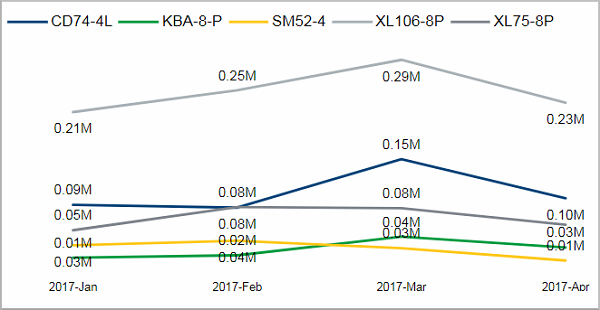
Facts & Dimensions:
•Y-axis [units]: Waste Volume
•Colors by: Device
•X-axis [date]: Year Month
Drillthrough:
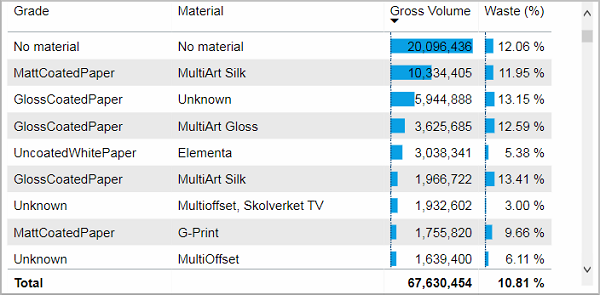
Facts & Dimensions:
Waste percentage by month and device
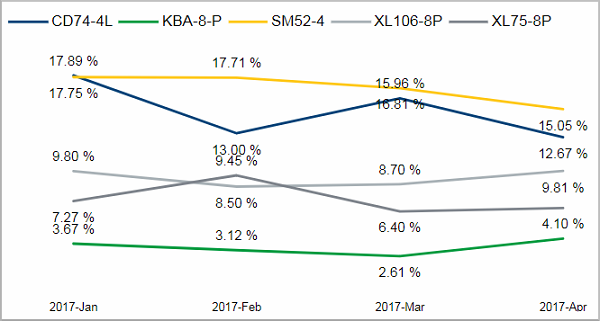
Facts & Dimensions:
•Y-axis [%]: Waste (%)
•Colors by: Device
•X-axis [date]:Year Month
Drillthrough: