(Change language of this page to: English, Deutsch)
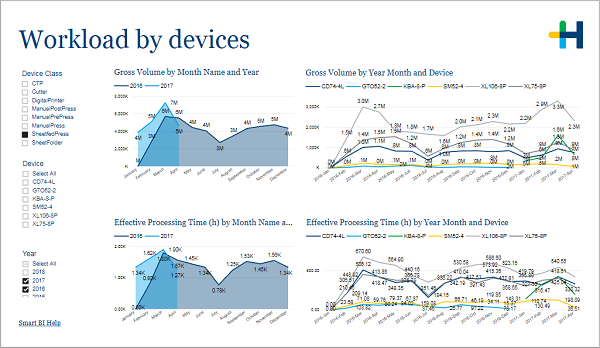
You can use this page to compare the workload of different devices of the same class. Simply choose the class in the filter area on the left.
....
In the filter area on the left you can adjust which devices and years are included in the charts.
•Gross volume by month and by year
•Gross volume by month and device
•Effective processing time by month and by year
•Effective processing time by month and by device
Gross volume by month and by year
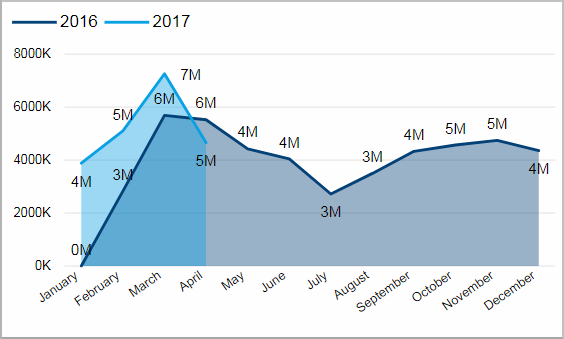
Facts & Dimensions:
•Y-axis [units]: Gross Volume
•Colors by: Year
•X-axis [date]: Month Name
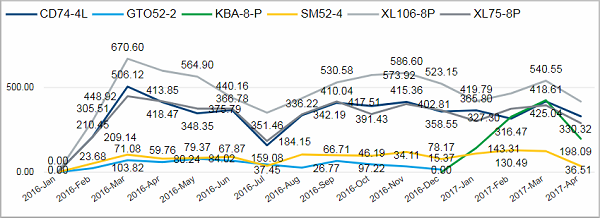
Gross volume by month and device
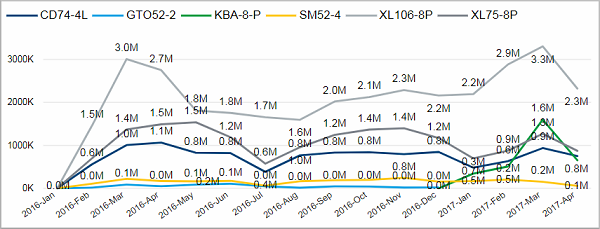
Facts & Dimensions:
•Y-axis [units]: Gross Volume
•Colors by: Device
•X-axis [date]: Year Month
Drillthrough:
Effective processing time by month and by year
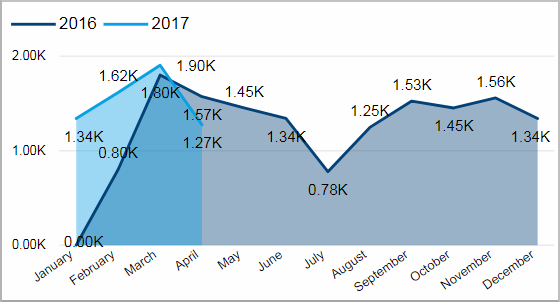
Facts & Dimensions:
•Y-axis [h]: Effective Processing Time (h)
•Colors by: Year
•X-axis [date]: Month Name
Effective processing time by month and by device
Facts & Dimensions:
•Y-axis [h]: Effective Processing Time (h)
•Colors by: Device
•X-axis [date]: Year Month
Drillthrough: