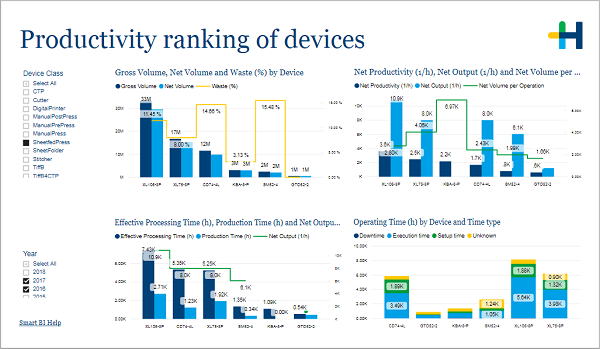
Productivity ranking of devices
(Change language of this page to: English, Deutsch)
This page shows various productivity results for different devices.
....
In the filter area on the left you can adjust which devices and years are included in the charts.
•Gross volume, net volume and waste percentage by device
•Net productivity per hour , net output per hour and net volume per operation by device
•Effective processing time, production time and net output by device
•Operating time by device and time type
Gross volume, net volume and waste percentage by device
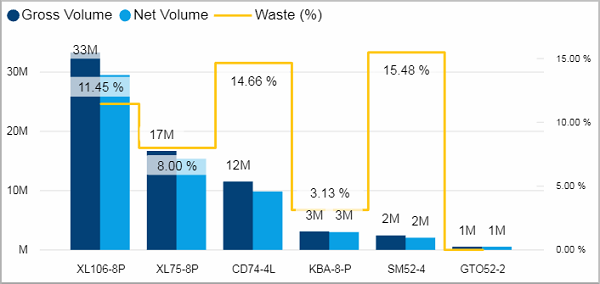
Facts & Dimensions:
•Y-axis Dark blue [units]: Gross Volume
•Y-axis Light blue line [units]: Net Volume
•Y-axis (2nd) Yellow line: Waste (%)
•X-axis: Device
Drillthrough:
Net productivity per hour , net output per hour and net volume per operation by device
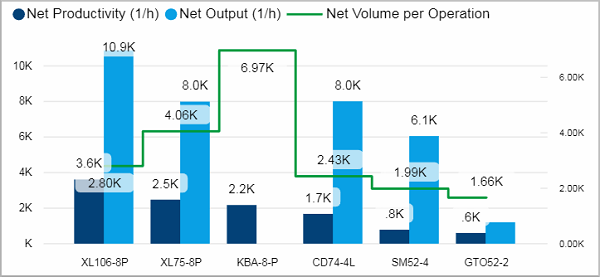
To view history month by month, use tooltips mechanism. Check Speed values monthly.
Facts & Dimensions:
•Y-axis Dark blue [units/h]: Net Productivity (1/h)
•Y-axis Light blue [units/h]: Net Output (1/h)
•Y-axis (2nd) Green line [units]: Net Volume per Operation
•X-axis: Device
Drillthrough:
Effective processing time, production time and net output by device
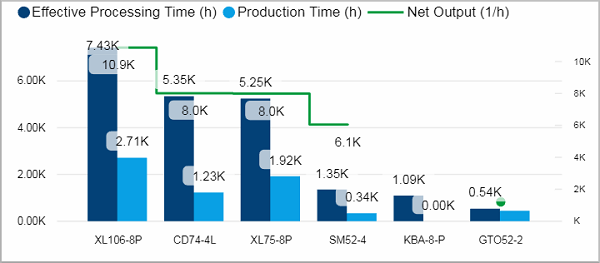
Facts & Dimensions:
•Y-axis Dark blue [h]: Effective Processing Time (h)
•Y-axis Light blue [h]: Production Time (h)
•Y-axis (2nd) Green line [units/h]: Net Output (1/h)
•X-axis: Device
Drillthrough:
Operating time by device and time type
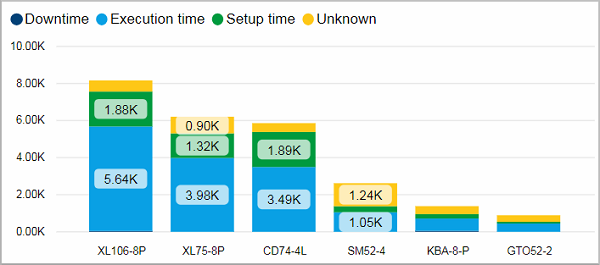
Tooltip: Check percentage share of Time types.
Facts & Dimensions:
•Y-axis [h]: Operating Time (h)
•Colors by: Time type
•X-axis: Device
Drillthrough: