(Change language of this page to: English, Deutsch)
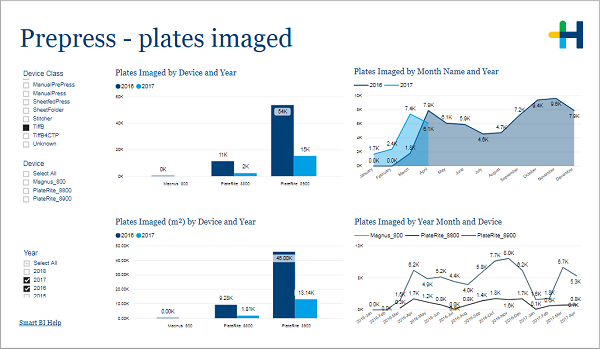
This page shows you the number of produced plates over time and by device.
....
In the filter area on the left you can adjust which devices and years are included in the charts.
•Number of produced plates by device and by year
•Number of produced plates by month and by year
•Square meters of produced plates by device and by year
•Number of produced plates by month and device
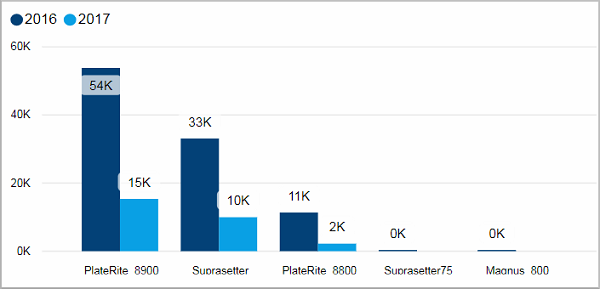
Number of produced plates by device and by year
Facts & Dimensions:
•Y-axis: Plates Imaged
•Colors by: Year
•X-axis: Device
Drillthrough:
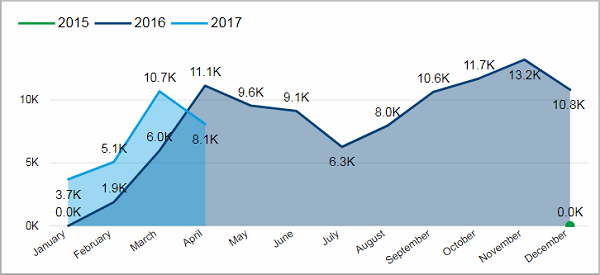
Number of produced plates by month and by year
Facts & Dimensions:
•Y-axis: Plates Imaged
•Colors by: Year
•X-axis [date]: Month Name
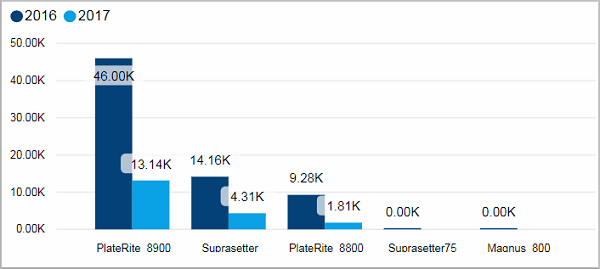
Square meters of produced plates by device and by year
Facts & Dimensions:
•Y-axis [m2]: Plates Imaged (m2)
•Colors by: Year
•X-axis: Device
Drillthrough:
Number of produced plates by month and device
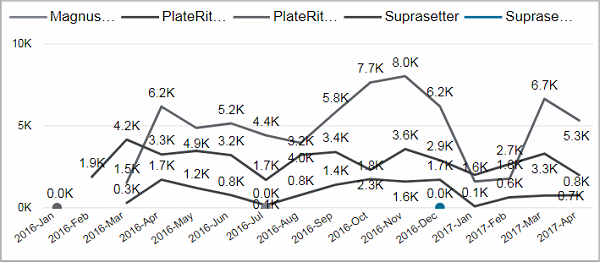
Facts & Dimensions:
•Y-axis: Plates Imaged
•Colors by: Device
•X-axis [date]: Year Month
Drillthrough: