(Change language of this page to: English, Deutsch)
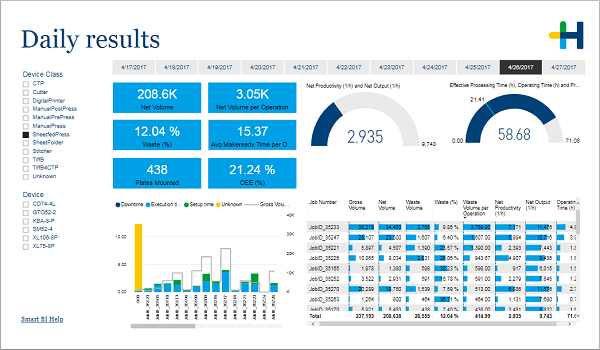
This page shows you key values for each day of the last 10 day period.
Additionally to the device filter area on the left, this page has an area above the visuals where you can select a day that should be displayed.
When clicking through the dates you can compare the following values from day to day:
•Avg Makeready Time per Operation (min)
The two gauge visuals show you how your net productivity compares to your net output and how your effective processing time compares to the operating time.
The column chart and the table give information for each job that was done on this day.