(Change language of this page to: English, Deutsch)
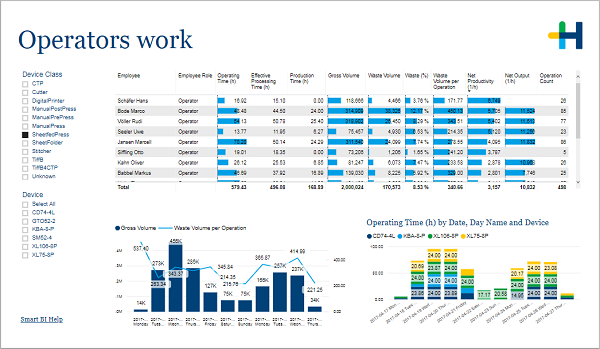
On this page you can gather information about the quantity and quality of your device operators work.
The key element of this page is the table that lists all employees with their individual results. Select an employee from the list to inspect (in the chart below on the left) how much gross volume and waste volume per operation this person produced in the last 10 days. The right chart then shows you how much time on each day this person spent operating various devices.