•Gross volume and waste volume per operation by date
•Operating Time (h) by date and device
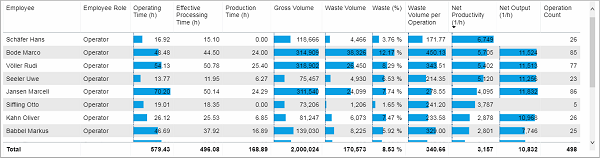
This table lists all employees and shows all related production factors.
Extending the table to full page size lets you review more data at once.
For pure numeric data it can be useful to go to “Show data” mode in the right upper corner. The resulting view lets you read the data more clearly.
Facts & Dimensions:
•Effective Processing Time (h)
Drillthrough:
Gross volume and waste volume per operation by date
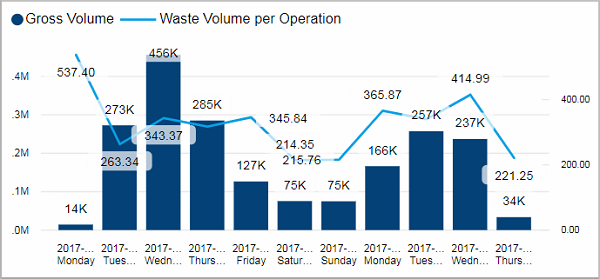
This chart has two differently scaled Y-axises that both show number of items. The left axis belongs to the gross volume that is depicted in columns for each day. The right axis shows the waste volume per operation for each day (light blue line).
Click on an employee in the list above to see only the results for this employee.
Facts & Dimensions:
•Y-axis Dark blue [units]: Gross Volume
•Y-axis (2nd) Light blue line [units]: Waste Volume per Operation
•X-axis [date]: Date and Day Name
Drillthrough:
Operating Time (h) by date and device
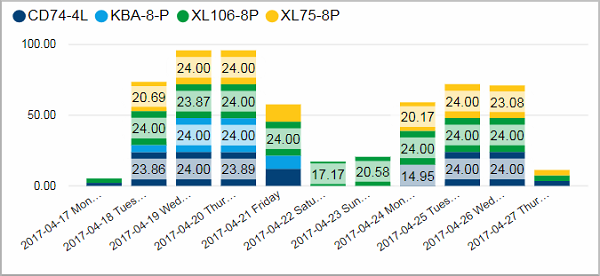
This stacked column chart puts the operating time for each device (color coded) on top of each other.
Click on an employee in the list above to see only the results for this employee.
See the page Utilization by Devices for more details about the time utilization.
Facts & Dimensions:
•Y-axis [h]: Operating Time (h)
•Colors by: Device
•X-axis [date]: Date and Day Name
Drillthrough: