(Change language of this page to: English, Deutsch)
This page presents an overview of the main figures of the OEE. See What is OEE?.
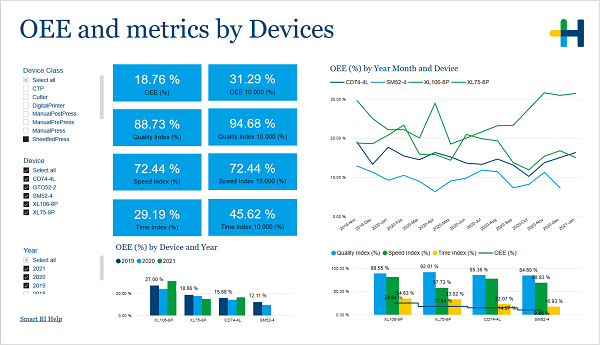
In the filter area on the left you can adjust which devices and years are shown in the charts.
The blue boxes on the left side give you the values for the OEE and its components calculated over the selected years and the boxes on the right side give you the same figures but normalized for a run length of 10.000 sheets.
The boxes show:
The three charts show you the device-dependent development of the OEE for each month, for each year and split into its components.