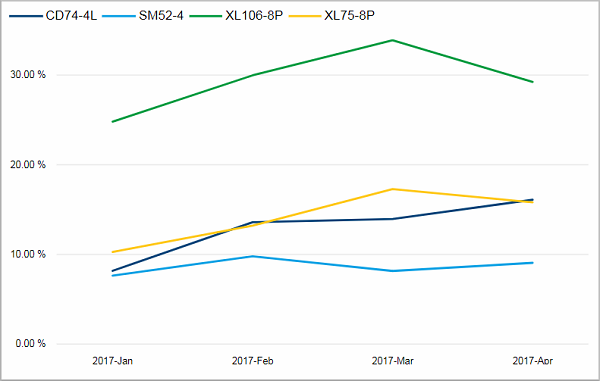
This chart shows the course of the average OEE per month for different devices.
Facts & Dimensions:
•Y-axis [%]: OEE (%)
•Colors by: Device
•X-axis [date]: Year Month
Drillthrough:
In this chart you can see how the OEE changed from year to year for each device. When you hover over the columns a tooltip displays that shows the OEE for each month for the respective device. This way you can compare the results of a month in different years.
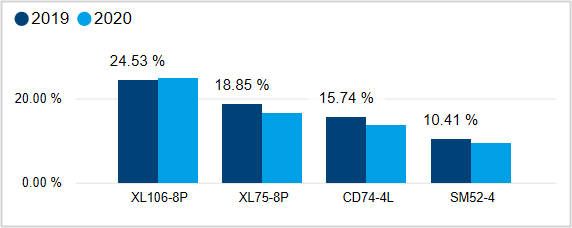
Facts & Dimensions:
•Y-axis [%]: OEE (%)
•Colors by: Year
•X-axis: Device
Drillthrough:
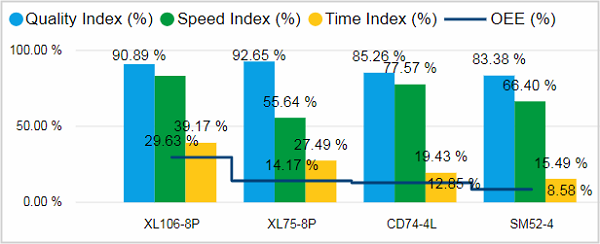
This chart shows the components of the OEE (that itself is represented by the blue line) for each device calculated over the years that are selected in the filter area. When you hover over a column a tooltip displays that shows the course of these values for each month.
In our case we find that the Time Index is lowering the OEE considerably.
Facts & Dimensions:
•Y-axis Light blue [%]: Quality Index (%)
•Y-axis Green [%]: Speed Index (%)
•Y-axis Yellow [%]: Time Index (%)
•Y-axis Dark blue line [%]: OEE (%)
•X-axis: Device
Drillthrough: