(Change language of this page to: English, Deutsch)
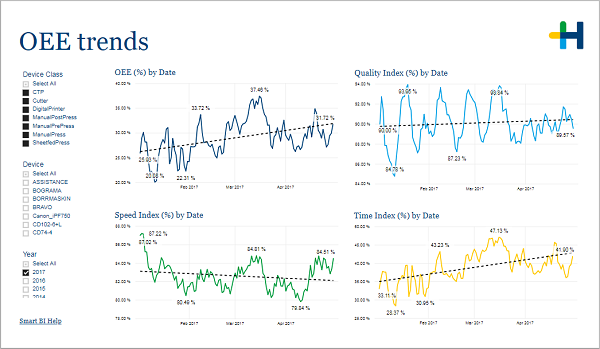
This page presents daily values for the OEE and its components. It can help you to identify outlier days and overall trends.
The four line charts show the daily values of the OEE and its components. The dashed line marks the overall trend.
In the filter area on the left you can adjust which devices and years are included in the charts.
See What is OEE?.