Key factors of the last 10 days - Production, Waste and Time
(Change language of this page to: English, Deutsch)
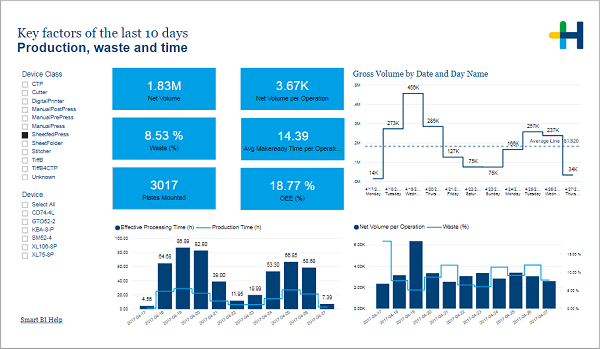
This page shows you how much gross volume was produced, how the time occupation of your devices was distributed and how much waste accrued for each of the last 10 days.
This page gives you the possibility to quickly evaluate if all basic indicators are following acceptable values. In case of critical aberrations the report will help you to identify the specific day for an in-depth evaluation.
In the left area you can chose for which device classes or individual devices the data is displayed. If you don’t select anything, the data is cumulated over all available devices.
The six boxes show you the numbers for:
•Avg Basic Makeready Time per Oper-ation (min)
The three visuals on this page show gross volume, effective processing time, production time, net volume per operation and waste percentage for each day. Tooltips offer additional visualization for each device. See Details of the tiles.
What to do when key factors deviate from the expectation:
Gross volume
•When it is lower than usual: Could it be a holiday or another expected situation (weekend)?
=> For further analysis go to the page Production and waste by devices and check the unusual days
Waste percentage
•When it is higher than usual: Is it justified by a higher number of operations?
=> For further analysis go to the page Production and waste by devices and check the unusual days
Effective processing time / production time
=> For further analysis go to the page Utilization by Devices and check the unusual days