(Change language of this page to: English, Deutsch)
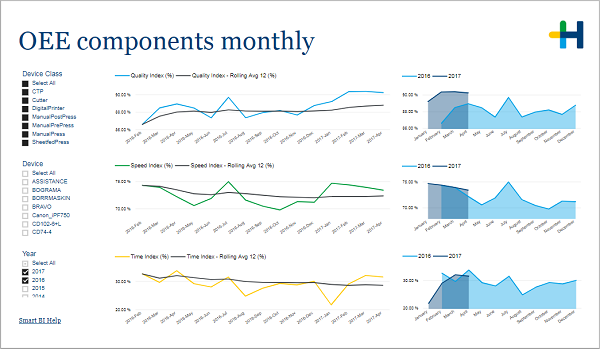
This page shows you the three components of the OEE calculated over all selected devices.
The line charts on the left-hand side show you the three OEE components (quality, speed and time) for each month. The black line gives you the rolling average. This way you can easily identify months that performed exceptionally well or poorly.
To see if the deviation from the average is just a seasonal occurrence, you can look at the charts on the right, where the components are shown for each month of the year with different years represented by colored lines.
In the filter area on the left you can adjust which devices and years are included in the charts.
See What is OEE?.