(Change language of this page to: English, Deutsch)
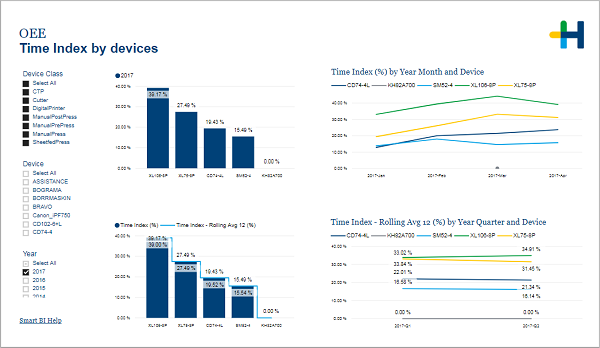
This page is dedicated to one component of the OEE: the Time Index. It helps you to compare the results for different devices in different time periods.
In the filter area on the left you can adjust which devices and years are included in the charts.
The first three charts show you the Time Index by device for different time periods: by year, by month and combined over the years that are selected in the filter area.
Filter for certain years to see how they performed compared to the 12 month rolling average in the third chart.
The last chart gives you the rolling average for each device by quarter. You can drill down to see the results by month.