Key factors of performance - Speed and utilization
(Change language of this page to: English, Deutsch)
This page shows you the speed of production overall and for each device separately. In addition, it allows you to compare the percentage of time that was spent for actual printing between the devices.
This page uses the following factors:
The net productivity is measured as the net volume that was produced per hour of operating time. It can thus be interpreted as a type of speed. The operating time includes down- and setup time.
The net output on the other hand only takes the number of good impressions and the actual printing time for these (starting with the first good sheet) into account.
The net volume per operation gives the average number of good prints per operation.
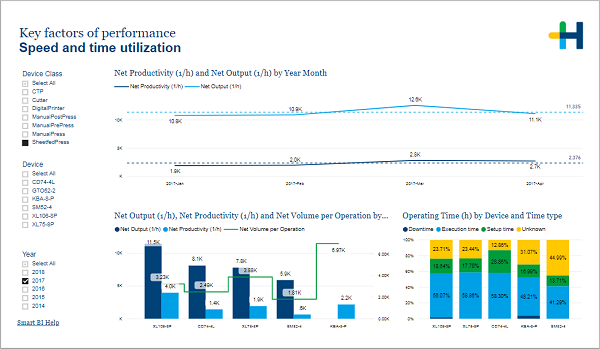
In the filter area on the left you can adjust which devices and years are included in the charts.
The first chart displays how many units were produced per hour for each month.
Below you can see the figures separated for each device. The left chart gives you the produced units per hour as well as the number of good prints per operation. The right chart shows you how the operating time is distributed into execution, setup, and downtime for each device. This way you could identify machines with exceptionally high setup times and investigate the cause.