•Net productivity per hour by device and year
•Net productivity per hour by month and device
•Net output per hour by device and year
•Net output per hour by month and device
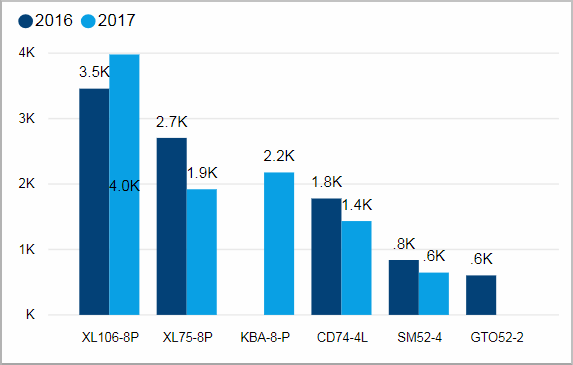
Net productivity per hour by device and year
This chart shows you the net productivity per hour for different devices by year.
Facts & Dimensions:
•Y-axis [units/h]: Net Productivity (1/h)
•Colors by: Year
•X-axis: Device
Drillthrough:
Net productivity per hour by month and device
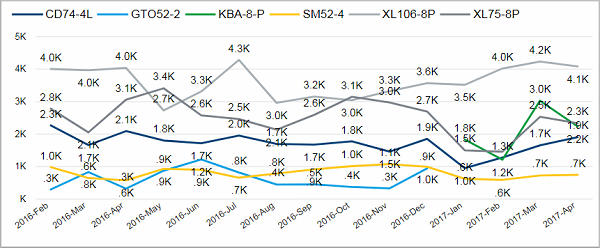
This chart shows you the course of the net productivity per hour for different devices over months.
Facts & Dimensions:
•Y-axis [units/h]: Net Productivity (1/h)
•Colors by: Device
•X-axis [date]: Year Month
Drillthrough:
Net output per hour by device and year
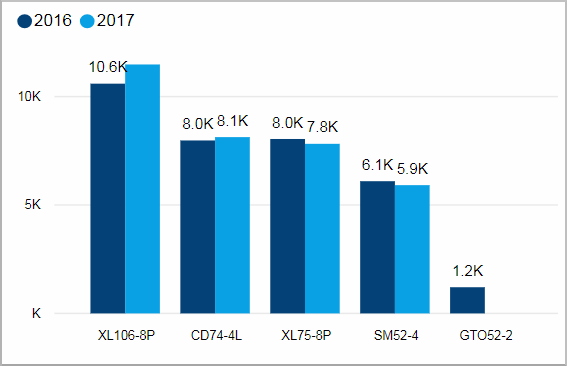
This chart shows you the net output per hour for different devices by year. You can get additional information in form of a tooltip when you hover over a column. A chart for the respective device and year will be displayed that shows the course of the net output over the months of this year for each operator.
Facts & Dimensions:
•Y-axis [units/h]: Net Output (1/h)
•Colors by: Year
•X-axis: Device
Drillthrough:
Net output per hour by month and device
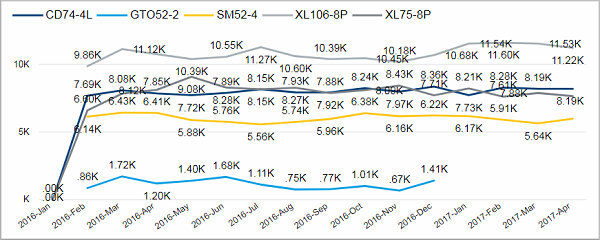
This chart shows you the course of the net output per hour for different devices over months.
Facts & Dimensions:
•Y-axis [units/h]: Net Output (1/h)
•Colors by: Device
•X-axis [date]: Year Month
Drillthrough: