•Effective Processing Time (h) by month and device
•Net Volume by month and device
•Net output per hour by month and device
•Net Volume per operation by month and device
•Net productivity per hour by month and device
•Waste percentage by month and device
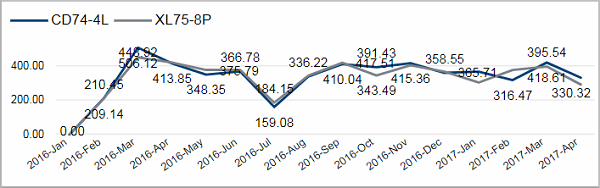
Effective Processing Time (h) by month and device
This chart shows the course of the effective processing time for each device by month.
Facts & Dimensions:
•Y-axis [h]: Effective Processing Time (h)
•Colors by: Device
•X-axis [date]: Year Month
Drillthrough:
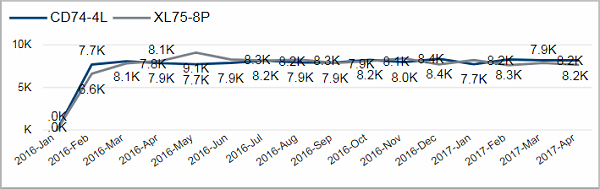
Net Volume by month and device

This chart shows the course of the net volume for each device by month.
Facts & Dimensions:
•Y-axis [units]: Net Volume
•Colors by: Device
•X-axis [date]: Year Month
Drillthrough:
Net output per hour by month and device
This chart shows the course of the net output per hour for each device by month.
Facts & Dimensions:
•Y-axis [units/h]: Net Output (1/h)
•Colors by: Device
•X-axis [date]: Year Month
Drillthrough:
Net Volume per operation by month and device
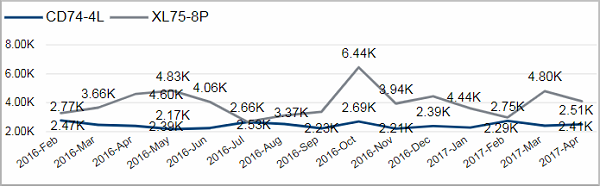
This chart shows the course of the net volume per operation for each device by month.
Facts & Dimensions:
•Y-axis [units]: Net Volume per Operation
•Colors by: Device
•X-axis [date]: Year Month
Drillthrough:
Net productivity per hour by month and device

This chart shows the course of the net productivity per hour for each device by month.
Facts & Dimensions:
•Y-axis [units/h]: Net Productivity (1/h)
•Colors by: Device
•X-axis [date]: Year Month
Drillthrough:
Waste percentage by month and device
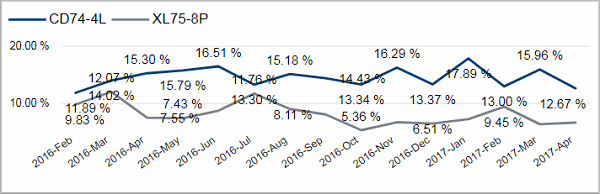
This chart shows the course of the waste percentage for each device by month.
Facts & Dimensions:
•Y-axis [%]: Waste (%)
•Colors by: Device
•X-axis [date]: Year Month
Drillthrough: