•Operating Time (h) by device and time type
•Operating Time (h), Effective Processing Time (h) and Production Time (h) by device
•Operating Time (h) by device and time type
•Effective Processing Time (h) by month and device
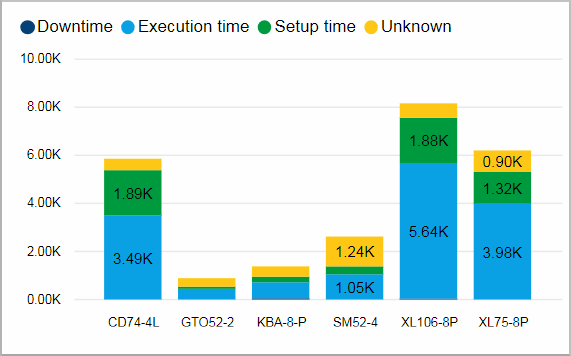
Operating Time (h) by device and time type
This chart shows the hours of operating time for different devices. The columns are split into the different time types: downtime, execution time and setup time.
Facts & Dimensions:
•Y-axis [h]: Operating Time (h)
•Colors by: Time type
•X-axis: Device
Drillthrough:
Operating Time (h), Effective Processing Time (h) and Production Time (h) by device
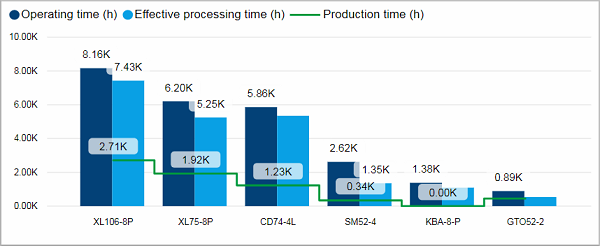
This chart shows the hours of operating time, effective processing time and production time for different devices
.
Facts & Dimensions:
•Y-axis Dark blue [h]: Operating Time (h)
•Y-axis Light blue [h]: Effective Processing Time (h)
•Y-axis Green line [h]: Production Time (h)
•X-axis: Device
Drillthrough:
Operating Time (h) by device and time type
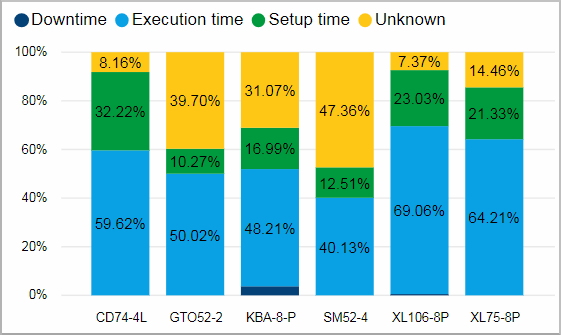
This chart shows the percentage of the operating time spent in the various time types for each device.
Facts & Dimensions:
•Y-axis [%]: Operating Time (h)
•Colors by: Time type
•X-axis: Device
Drillthrough:
Effective Processing Time (h) by month and device
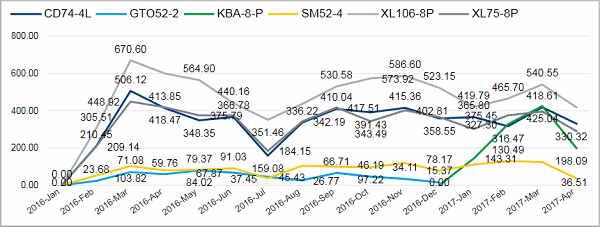
This chart shows the course of the effective processing time by months for the different devices.
Facts & Dimensions:
•Y-axis [h]: Effective Processing Time (h)
•Colors by: Device
•X-axis [date]: Year Month
Drillthrough: