•Average basic make-ready time per month
•Average basic make-ready time per operation by device
•Wash-up cycle count and wash-up time per 1000 impressions
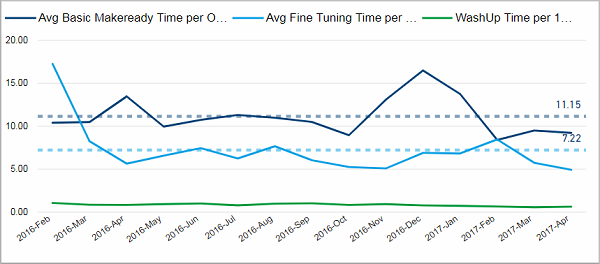
Average basic make-ready time per month
This chart shows the average basic make-ready time and fine-tuning time per operation in minutes for each month. Additionally, you can see the wash-up time per 1000 impressions. To see weekly results, you can use "Drill Down".
Facts & Dimensions:
•Y-axis Dark blue line [min]: Avg Basic Makeready Time per Oper-ation (min)
•Y-axis Light blue line [min]: Avg Fine Tuning Time per Operation (min)
•Y-axis Green line [min]: WashUp Time per 1000 Impressions (min)
•X-axis [date]: Year Month
•Drill Down => X-axis [date]: ISO Week
Drillthrough:
Average basic make-ready time per operation by device
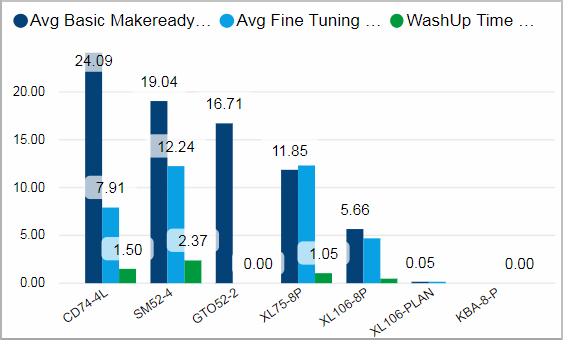
This chart shows the average basic make-ready time and fine-tuning time per operation as well as the wash-up time per 1000 impressions in minutes for each device.
Facts & Dimensions:
•Y-axis Dark blue [min]: Avg Basic Makeready Time per Oper-ation (min)
•Y-axis Light blue [min]: Avg Fine Tuning Time per Operation (min)
•Y-axis Green[min]: WashUp Time per 1000 Impressions (min)
•X-axis: Device
Wash-up cycle count and wash-up time per 1000 impressions
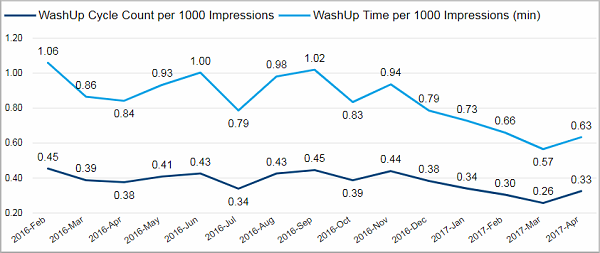
This chart shows the wash-up cycle count and the wash-up time per 1000 impressions by month. You can use "Drill Down" to see weekly results.
Facts & Dimensions:
•Y-axis Dark blue line: WashUp Cycle Count per 1000 Impressions
•Y-axis Light blue line: WashUp Time per 1000 Impressions (min)
•X-axis [date]: Year Month
•Drill Down => X-axis [date]: ISO Week
Drillthrough: