•Average basic make-ready time per operation by device and year
•Wash-up time per 1000 impressions by device and year
•Average fine-tuning time per operation by device and year
•Wash-up cycle count by device and year
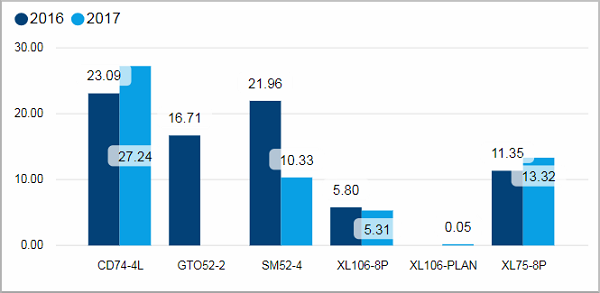
Average basic make-ready time per operation by device and year
This chart shows the average basic make-ready time per operation in minutes for each device. Each column represents the results of one year.
Facts & Dimensions:
•Y-axis [min]: Avg Basic Makeready Time per Oper-ation (min)
•Colors by: Year
•X-axis: Device
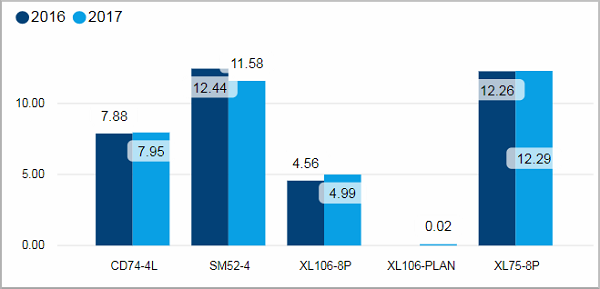
Wash-up time per 1000 impressions by device and year
This chart shows the wash-up time per 1000 impressions in minutes for each device. Each column represents the results of one year.
Facts & Dimensions:
•Y-axis [min]: WashUp Time per 1000 Impressions (min)
•Colors by: Year
•X-axis: Device
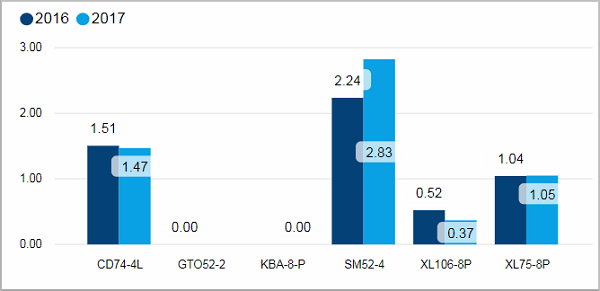
Average fine-tuning time per operation by device and year
This chart shows the average fine-tuning time per operation in minutes for each device. Each column represents the results of one year.
Facts & Dimensions:
•Y-axis [min]: Avg Fine Tuning Time per Operation (min)
•Colors by: Year
•X-axis: Device
Wash-up cycle count by device and year
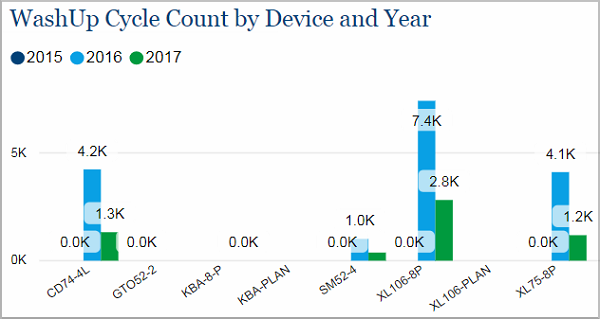
This chart shows the wash-up cycle count for each device. Each column represents the results of one year.
Facts & Dimensions:
•Y-axis: WashUp Cycle Count
•Colors by: Year
•X-axis: Device