•Average make-ready time per operation by month and device
•Wash-up time per 1000 impressions by month and device
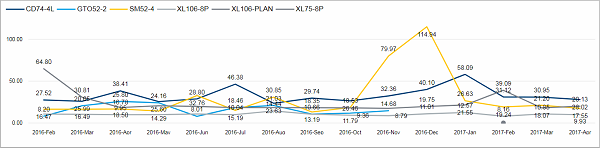
Average make-ready time per operation by month and device
This chart shows the course of the average make-ready time per operation in minutes by month. Each device is represented with a different colored line.
Facts & Dimensions:
•Y-axis [min]: Avg Makeready Time per Operation (min)
•Colors by: Device
•X-axis: Year Month
Drillthrough:
Wash-up time per 1000 impressions by month and device
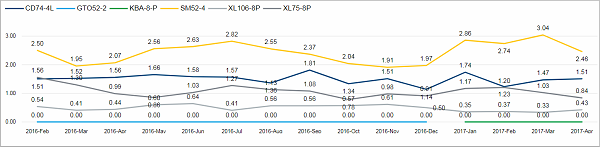
This chart shows the course of the wash-up time per 1000 impressions in minutes by month. Each device is represented with a different colored line.
Facts & Dimensions:
•Y-axis [min]: WashUp Time per 1000 Impressions (min)
•Colors by: Device
•X-axis: Year Month
Drillthrough: