•Map of the gross volume by average make-ready time per operation
•Average basic make-ready time per operation by device
•Average basic make-ready time per operation by material
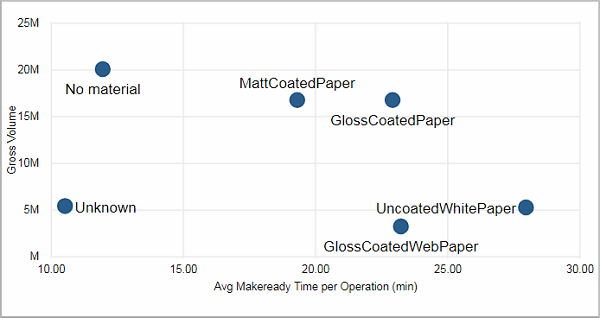
Map of the gross volume by average make-ready time per operation
This scatter chart places grades of materials as dots on a grid that consists of the gross volume and the average make-ready time per operation.
Facts & Dimensions:
•Y-axis [units]: Gross Volume
•Dots: Grade
•X-axis [min]: Avg Makeready Time per Operation (min)
Average basic make-ready time per operation by device
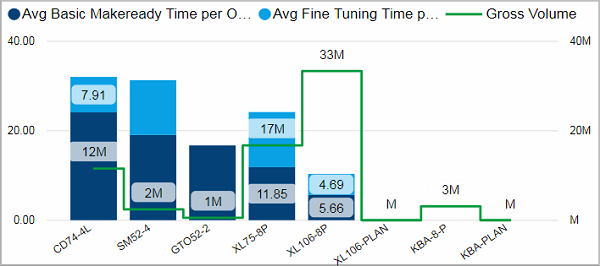
This chart shows the average basic make-ready and fine-tuning time per operation in minutes for each device. These two time intervals add up to the average make-ready time per operation which therefore is represented by the height of the whole column.
The column chart is overlaid with a second line chart that shows the gross volume with a green line. Its scale is visible on the right side.
Facts & Dimensions:
•Y-axis Dark blue [min]: Avg Basic Makeready Time per Oper-ation (min)
•Y-axis Light blue [min]: Avg Fine Tuning Time per Operation (min)
•Y-axis (2nd) Green line [units]: Gross Volume
•X-axis: Device
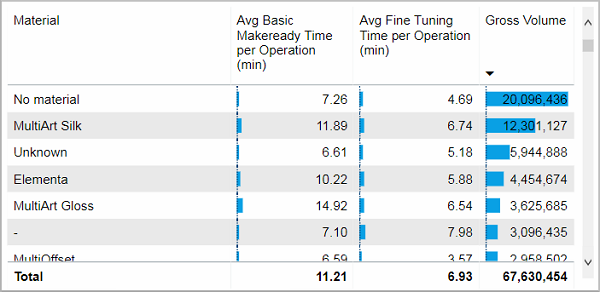
This table lists the average basic make-ready and fine-tuning time per operation in minutes as well as the produced gross volume for each material.
Facts & Dimensions:
•Avg Basic Makeready Time per Oper-ation (min)
•Avg Fine Tuning Time per Operation (min)
Average basic make-ready time per operation by material
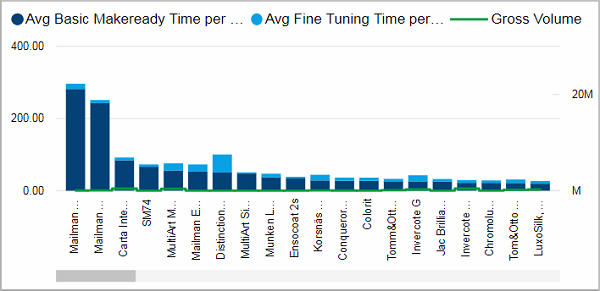
This chart shows the average basic make-ready and fine-tuning time per operation in minutes for each material. These two time intervals add up to the average make-ready time per operation which therefore is represented by the height of the whole column.
The column chart is overlaid with a second line chart that shows the gross volume with a green line. Its scale is visible on the right side.
Facts & Dimensions:
•Y-axis Dark blue [min]: Avg Basic Makeready Time per Oper-ation (min)
•Y-axis Light blue [min]: Avg Fine Tuning Time per Operation (min)
•Y-axis (2nd) Green line [units]: Gross Volume
•X-axis: Material