•Ordered Value and Ordered Value Rolling Average 3 per Year Month.
•Ordered Value by Representative
•Ordered Value by Customer Group
•Ordered Value by Product Group
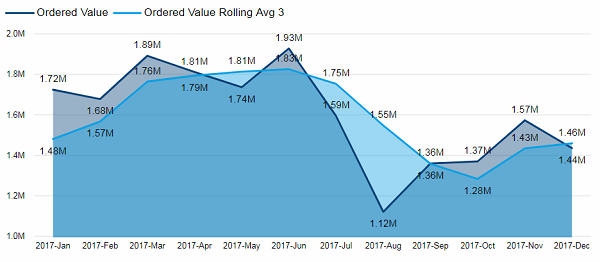
Ordered Value and Ordered Value Rolling Average 3 per Year Month.
This visual displays the ordered value for every month of the selected year. The light blue line shows the ordered value averaged over the last three months.
For example the Ordered Value Rolling Avg 3 for August is:
(Ordered Value of August + Ordered Value of July + Ordered Value of June)/3
= (1.12M + 1.59M+ 1.93M)/3
= 1.55M
This way outliers are smoothed out and you can recognize trends more easily.
Facts & Dimensions:
·Y-axis Dark blue [currency]: Ordered Value
·Y-axis Light blue [currency]: Ordered Value Rolling Avg 3
·X-axis [time]: Year Month
Ordered Value by Representative
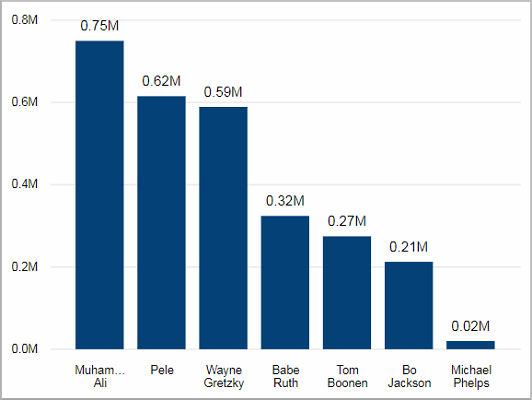
This visual displays the top seven representatives by ordered value.
Facts & Dimensions:
·Y-axis [currency]: Ordered Value
·X-axis: Representative
Drillthrough:
Ordered Value by Customer Group
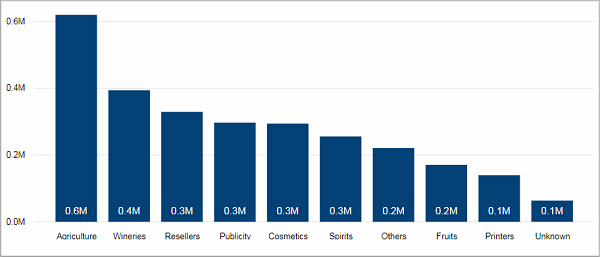
This visual shows the top 10 customer groups sorted by ordered value (in the selected time period).
When you right click on a customer group, you can drill down to see the ordered value of all customers that are part of this group.
Facts & Dimensions:
·Y-axis [currency]: Ordered Value
·X-axis: Customer Group
·Drill Down => X-axis: Customer
Drillthrough:
Ordered Value by Product Group
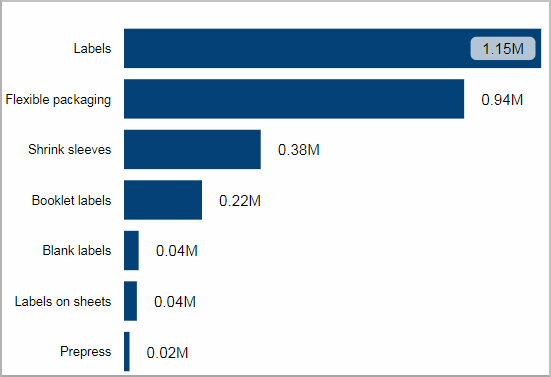
Top Product Groups by Ordered Value
This visual shows the top 7 product groups sorted by ordered value (in the selected time period).
When you right click on a product group, you can drill down to see the ordered value of all products that are part of this group.
Facts & Dimensions:
·Y-axis: Product Group
·X-axis [currency]: Ordered Value
·Drill Down => Y-axis: Product
Drillthrough:
HD Privacy Statement | Imprint | Prinect Know How