•Top Representatives by Ordered Value YTD and YTD PY
•Top Customers by Ordered Value YTD YoY
•Top Product Groups by Ordered Value YTD
•Bottom Customers by Ordered Value Difference YTD YoY
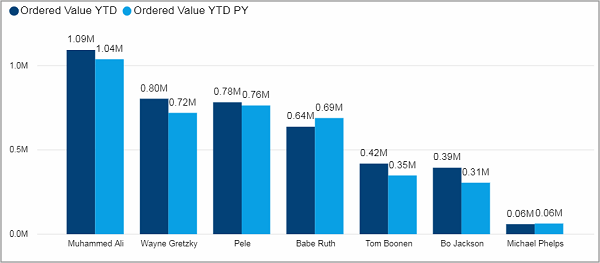
Top Representatives by Ordered Value YTD and YTD PY
This visual shows you the top 7 representatives by their ordered value in the time from the start of the selected year to todays date in the selected year. The light blue column shows the ordered value in the same time period but one year before.
Facts & Dimensions:
·Y-axis Dark blue [currency]: Ordered Value YTD
·Y-axis Light blue [currency]: Ordered Value YTD PY
·X-axis: Representative
·Tooltip: Ordered Value YTD YoY
·Tooltip: Ordered Value YTD YoY %
Drillthrough:
Top Customers by Ordered Value YTD YoY
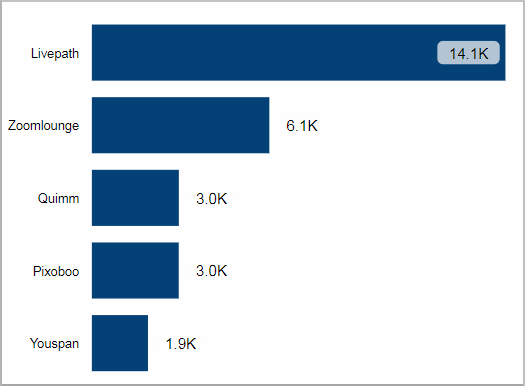
This visual shows you the customers with the highest growth of the ordered value in absolute numbers compared to the previous year.
As in the visual before the ordered value is summed up over the days of the selected year from the start to todays date.
Facts & Dimensions:
·Y-axis: Customer
·X-axis [currency]: Ordered Value YTD YoY
·Tooltip: Ordered Value YTD
·Tooltip: Ordered Value YTD PY
·Tooltip: Ordered Value YTD YoY %
Drillthrough:
Top Product Groups by Ordered Value YTD
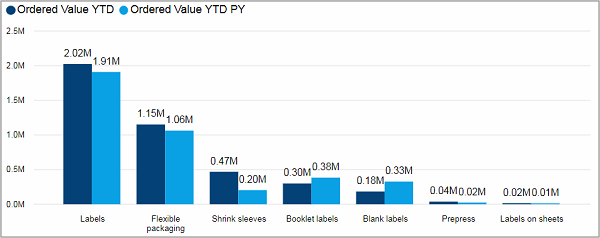
This visual shows you the top 7 product groups by their ordered value in the time from the start of the selected year to todays date in the selected year. The light blue column shows the ordered value in the same time period but one year before.
Facts & Dimensions:
·Y-axis Dark blue [currency]: Ordered Value YTD
·Y-axis Light blue [currency]: Ordered Value YTD PY
·X-axis: Product Group
·Tooltip: Ordered Value YTD YoY
·Tooltip: Ordered Value YTD YoY %
Drillthrough:
Bottom Customers by Ordered Value Difference YTD YoY
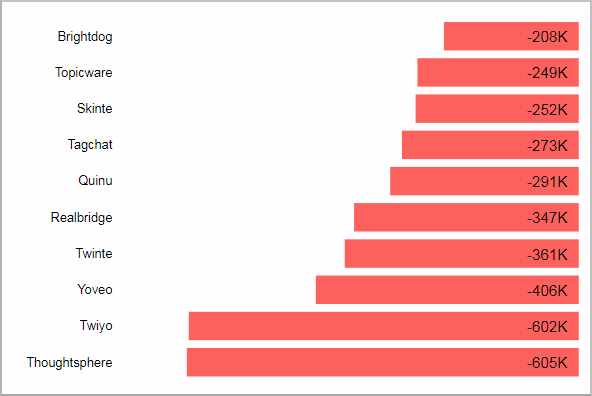
This visual shows you the customers with the highest decrease of the ordered value in absolute numbers compared to the previous year.
As in the visuals before the ordered value is summed up over the days of the selected year from the start to todays date.
Facts & Dimensions:
·Y-axis: Customer
·X-axis [currency]: Ordered Value YTD YoY
·Tooltip: Ordered Value YTD
·Tooltip: Ordered Value YTD PY
·Tooltip: Ordered Value YTD YoY %
Drillthrough:
HD Privacy Statement | Imprint | Prinect Know How