•Top Representatives by Ordered Value in the last 30 days
•Top Customer Groups by Ordered Value in the last 30 days
•Top Product Groups by Ordered Value in the last 30 days
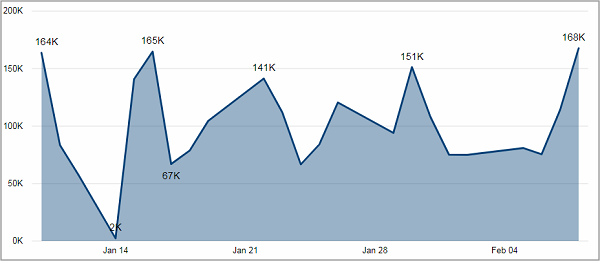
This visual shows you the ordered value of the last 30 days. It is not affected by the Date selection of the page.
Facts & Dimensions:
·Y-axis [currency]: Ordered Value
·X-axis [date]: Date
Top Representatives by Ordered Value in the last 30 days
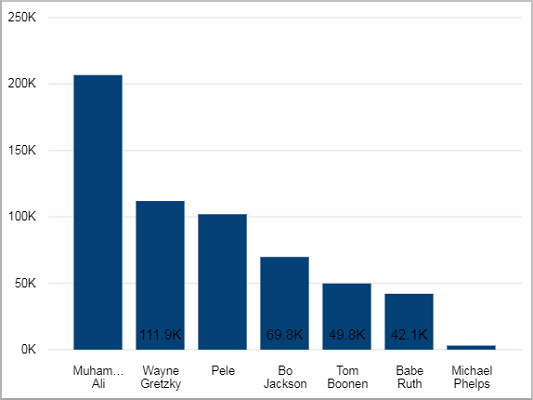
This visual shows you the representatives with the highest ordered value in the last 30 days.
Facts & Dimensions:
·Y-axis [currency]: Ordered Value
·X-axis: Representative
Drillthrough:
Top Customer Groups by Ordered Value in the last 30 days
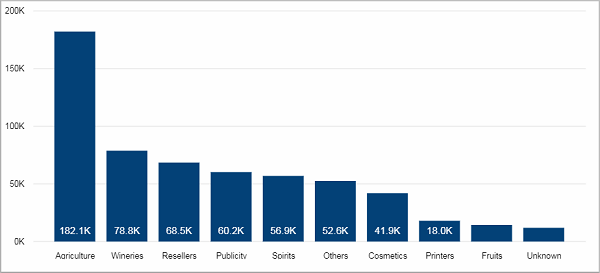
This visual shows you the customer groups with the highest ordered value in the last 30 days. You can drill down to see the results for the individual customers of that group.
Facts & Dimensions:
·Y-axis [currency]: Ordered Value
·X-axis: Customer Group
·Drill Down => X-axis: Customer
Drillthrough:
Top Product Groups by Ordered Value in the last 30 days
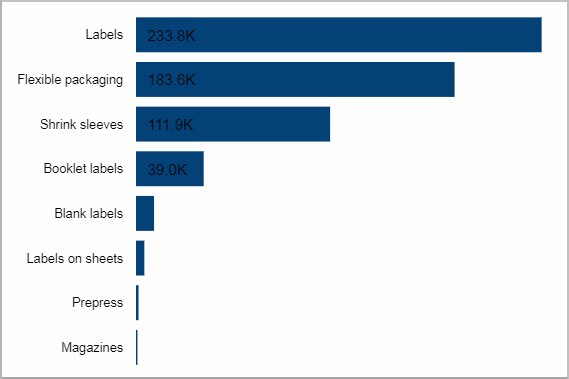
This visual shows you the product groups with the highest ordered value in the last 30 days. You can drill down to see the results for the individual products of that group.
Facts & Dimensions:
·Y-axis: Product Group
·X-axis [currency]: Ordered Value
·Drill Down => Y-axis: Product
Drillthrough:
HD Privacy Statement | Imprint | Prinect Know How