•Waste Volume per Operation and Net Volume per Operation
Facts & Dimensions:
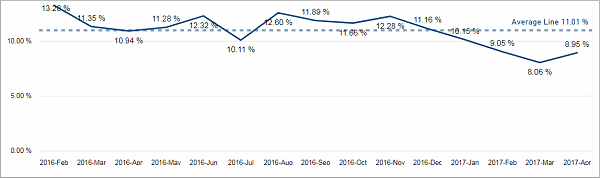
•Y-axis [%]: Waste (%)
•X-axis [date]: Year Month
•Drill Down => X-axis [date]: ISO Week
For easier insight into history of Waste percentage on Device the tooltips mechanism can be used – after moving mouse over a bar based on Device some additional information is presented: Waste percentage by Operators monthly.
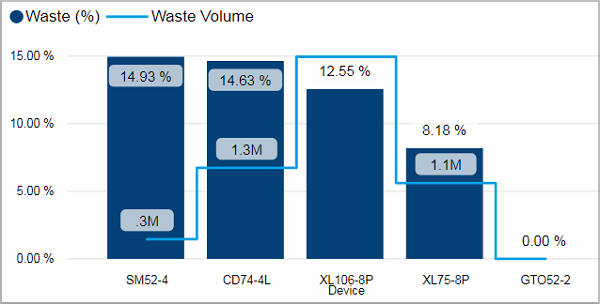
Facts & Dimensions:
•Y-axis Dark blue [%]: Waste (%)
•Y-axis (2nd) Light blue line [units]: Waste Volume
•X-axis: Device
Drillthrough:
Waste Volume per Operation and Net Volume per Operation
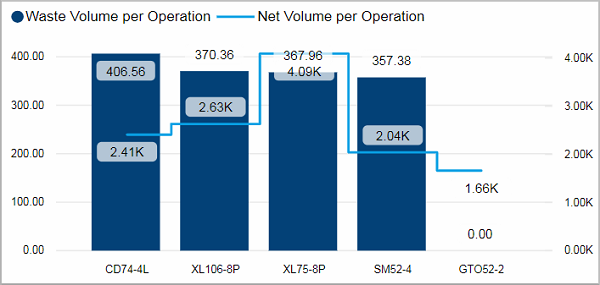
History of Waste Volume per Operation is accessible by Tooltips.
Facts & Dimensions:
•Y-axis Dark blue [units]: Waste Volume per Operation
•Y-axis (2nd) Light blue line [units]: Net Volume per Operation
•X-axis: Device
Drillthrough:
HD Privacy Statement | Imprint | Prinect Know How