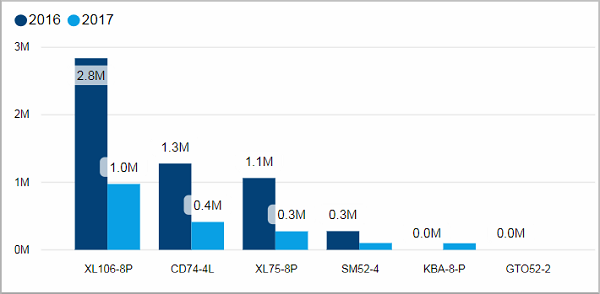
•Waste Volume by Device and Year
•Waste Volume per Operation by Device and Year
Waste Volume by Device and Year
Facts & Dimensions:
•Y-axis [units]: Waste Volume
•Colors by: Year
•X-axis: Device
Drillthrough:
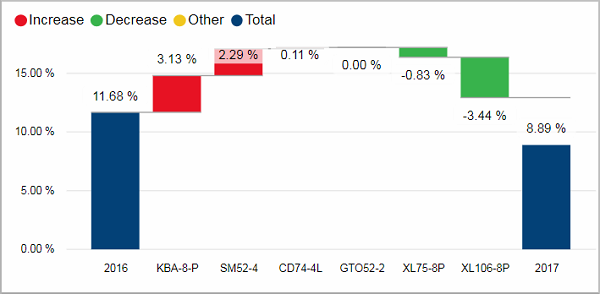
Waterfall chart shows Devices acting the biggest impact on Waste percentage factor year to year.
Facts & Dimensions:
•Y-axis [%]: Waste (%)
For easier insight into history of Waste percentage on Device the tooltips mechanism can be used – after moving mouse over a bar based on Device some additional information is presented: Waste percentage by Operators monthly.
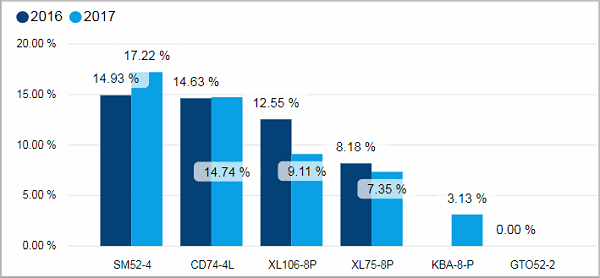
Facts & Dimensions:
•Y-axis [%]: Waste (%)
•Colors by: Year
•X-axis: Device
Drillthrough:
Waste Volume per Operation by Device and Year
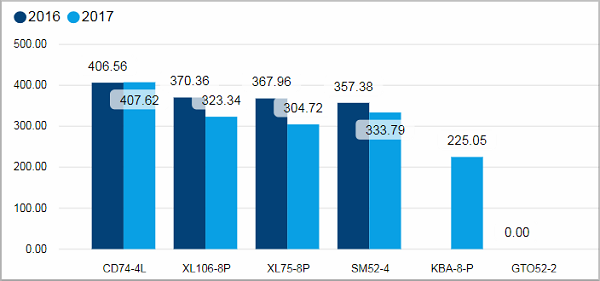
History of Avg. Waste Volume / operation by Operators are also accessible by Tooltips.
Facts & Dimensions:
•Y-axis [units]: Waste Volume per Operation
•Colors by: Year
•X-axis: Device
Drillthrough:
HD Privacy Statement | Imprint | Prinect Know How