•Operation Count by Year Month and Device
•Waste (%) by Year Month and Device
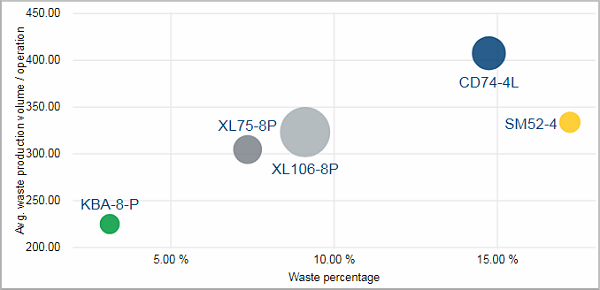
•Waste Volume per Operation by Year Month and Device
The size of the dot corresponds to the waste volume.
Facts & Dimensions:
•Y-axis [units]: Waste Volume per Operation
•Dots: Device
•Size by: Waste Volume
•X-axis [%]: Waste (%)
Drillthrough:
Operation Count by Year Month and Device
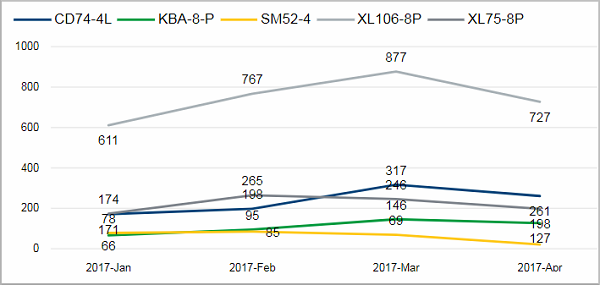
Facts & Dimensions:
•Y-axis: Operation Count
•Colors by: Device
•X-axis [date]: Year Month
Drillthrough:
Waste (%) by Year Month and Device
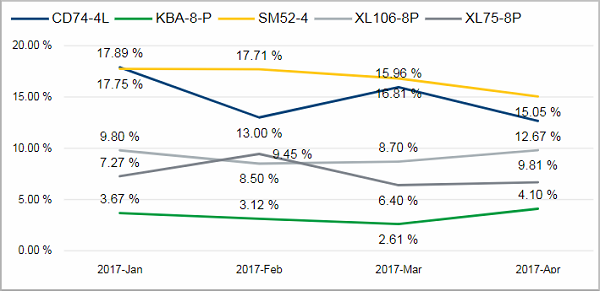
Facts & Dimensions:
•Y-axis: Waste (%)
•Colors by: Device
•X-axis [date]: Year Month
Drillthrough:
Waste Volume per Operation by Year Month and Device
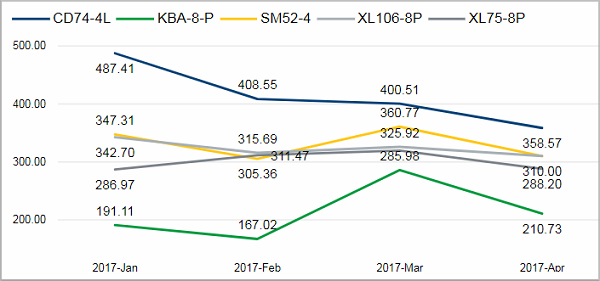
Facts & Dimensions:
•Y-axis [units]: Waste Volume per Operation
•Colors by: Device
•X-axis [date]: Year Month
Drillthrough:
HD Privacy Statement | Imprint | Prinect Know How