•Gross Volume, Net Volume and Waste (%) by Device
•Net Productivity (1/h), Net Output (1/h) and Net Volume per Operation by Device
•Effective Processing Time (h), Production Time (h) and Net Output (1/h) by Device
•Operating Time (h) by Device and Time type
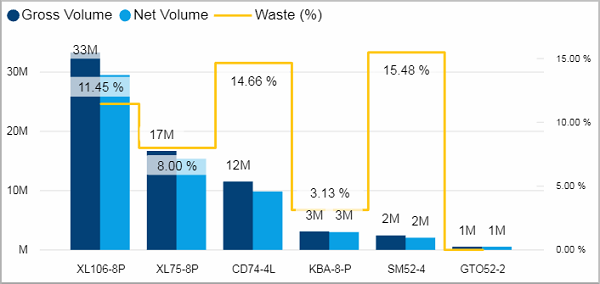
Gross Volume, Net Volume and Waste (%) by Device
Facts & Dimensions:
•Y-axis Dark blue [units]: Gross Volume
•Y-axis Light blue line [units]: Net Volume
•Y-axis (2nd) Yellow line: Waste (%)
•X-axis: Device
Drillthrough:
Net Productivity (1/h), Net Output (1/h) and Net Volume per Operation by Device
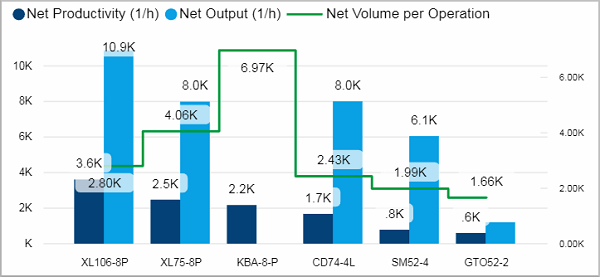
To view history month by month use Tooltips mechanism. Check Speed values monthly.
Facts & Dimensions:
•Y-axis Dark blue [1/h]: Net Productivity (1/h)
•Y-axis Light blue [1/h]: Net Output (1/h)
•Y-axis (2nd) Green line [units]: Net Volume per Operation
•X-axis: Device
Drillthrough:
Effective Processing Time (h), Production Time (h) and Net Output (1/h) by Device
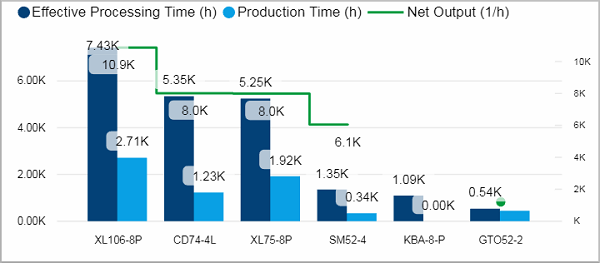
Facts & Dimensions:
•Y-axis Dark blue [h]: Effective Processing Time (h)
•Y-axis Light blue [h]: Production Time (h)
•Y-axis (2nd) Green line [1/h]: Net Output (1/h)
•X-axis: Device
Drillthrough:
Operating Time (h) by Device and Time type
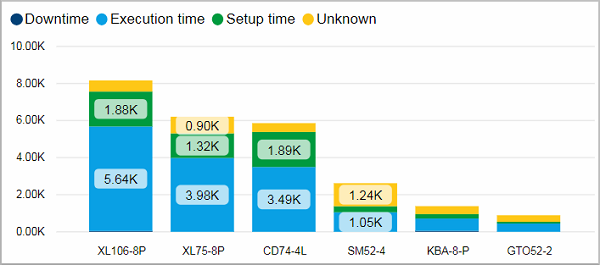
Tooltip: Check percentage share of Time types.
Facts & Dimensions:
•Y-axis [h]: Operating Time (h)
•Colors by: Time type
•X-axis: Device
Drillthrough:
HD Privacy Statement | Imprint | Prinect Know How