•OEE (%) by Year Month and Device
•Quality Index (%), Speed Index (%), Time Index (%) and OEE (%)
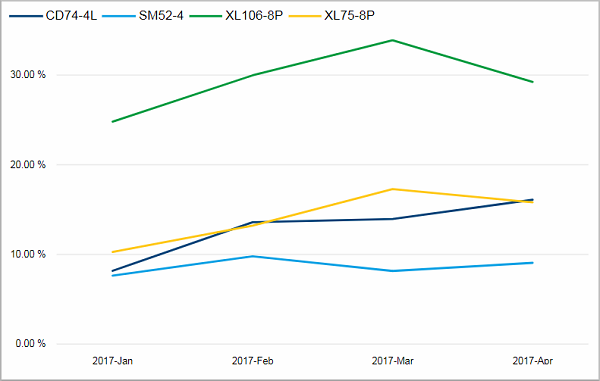
OEE (%) by Year Month and Device
Facts & Dimensions:
•Y-axis [%]: OEE (%)
•Colors by: Device
•X-axis [date]: Year Month
Drillthrough:
For easier and fast insight of Device’s data use Tooltips mechanism to check the OEE (%) month to month.
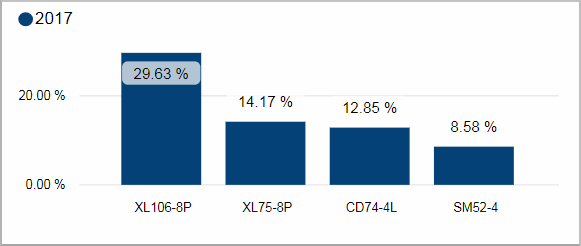
Facts & Dimensions:
•Y-axis [%]: OEE (%)
•Colors by: Year
•X-axis: Device
Drillthrough:
Quality Index (%), Speed Index (%), Time Index (%) and OEE (%)
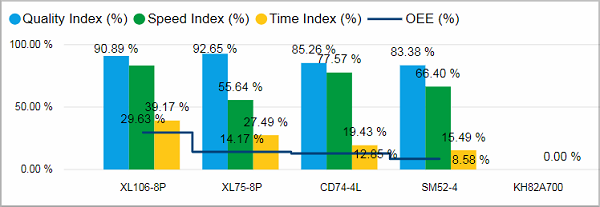
Monthly view of each component for Device.
Facts & Dimensions:
•Y-axis Light blue [%]: Quality Index (%)
•Y-axis Green [%]: Speed Index (%)
•Y-axis Yellow [%]: Time Index (%)
•Y-axis Dark blue line [%]: OEE (%)
•X-axis: Device
Drillthrough:
HD Privacy Statement | Imprint | Prinect Know How