•Time Index (%) by Year and Device
•Time Index (%) by Year Month and Device
•Time Index (%) and Time Index - Rolling Avg 12 (%)
•Time Index - Rolling Avg 12 (%) by Year Quarter and Device
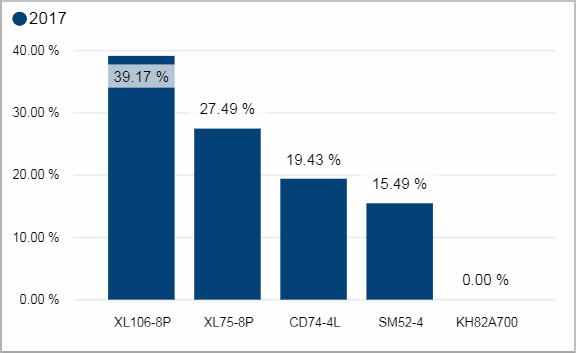
Time Index (%) by Year and Device
Facts & Dimensions:
•Y-axis [%]: Time Index (%)
•Colors by: Year
•X-axis: Device
Drillthrough:
Time Index (%) by Year Month and Device
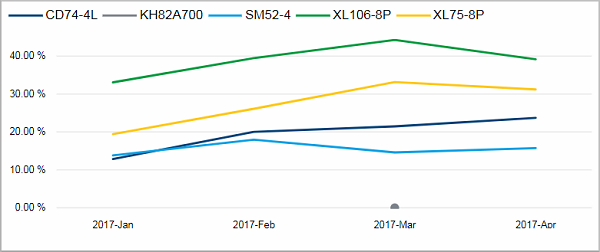
Facts & Dimensions:
•Y-axis [%]: Time Index (%)
•Colors by: Device
•X-axis [date]: Year Month
•Drill Up => X-axis [date]: Year Quarter
Drillthrough:
Time Index (%) and Time Index - Rolling Avg 12 (%)
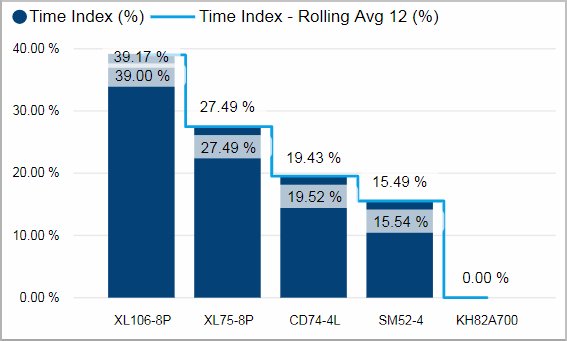
Facts & Dimensions:
•Y-axis Dark blue [%]: Time Index (%)
•Y-axis Light blue line [%]: Time Index - Rolling Avg 12 (%)
•X-axis: Device
Drillthrough:
Time Index - Rolling Avg 12 (%) by Year Quarter and Device
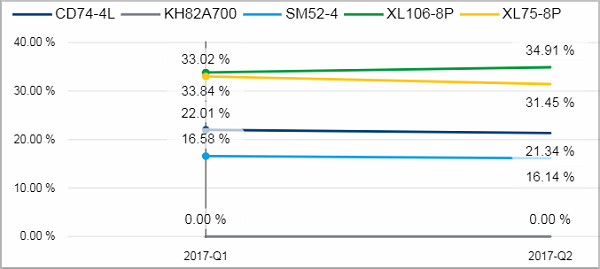
Facts & Dimensions:
•Y-axis [%]: Time Index - Rolling Avg 12 (%)
•Colors by: Device
•X-axis [date]: Year Quarter
•Drill Down => X-axis [date]: Year Month
Drillthrough:
HD Privacy Statement | Imprint | Prinect Know How