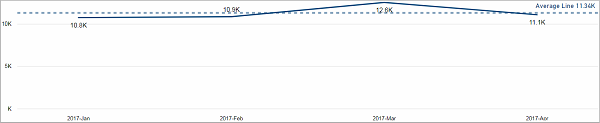
•Net Output (1/h) by Year Month
•[WORSE 10] Net Output (1/h) and Gross Volume by Employee
•[BEST 10] Net Output (1/h) and Gross Volume by Employee
Net Output (1/h) by Year Month
Facts & Dimensions:
•Y-axis [1/h]: Net Output (1/h)
•X-axis [date]: Year Month
•Drill Down => X-axis [date]: ISO Week
[WORSE 10] Net Output (1/h) and Gross Volume by Employee
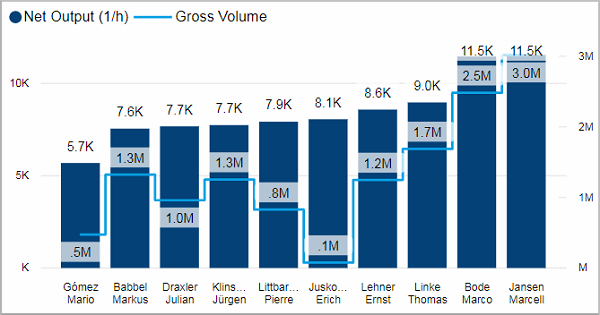
For easier and fast insight of Operator’s data use Tooltips mechanism to check the Net output factor in time and on specific Devices.
Facts & Dimensions:
•Y-axis Dark blue [1/h]: Net Output (1/h)
•Y-axis (2nd) Light blue line [units]: Gross Volume
•X-axis: Employee
Drillthrough:
[BEST 10] Net Output (1/h) and Gross Volume by Employee
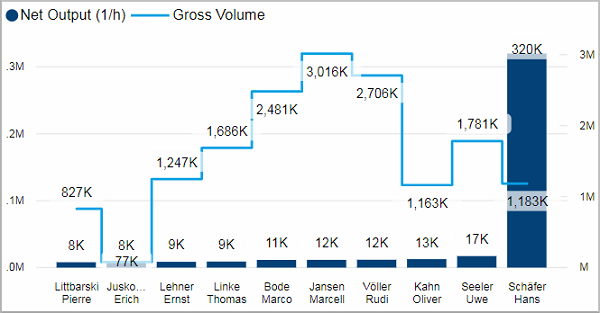
Facts & Dimensions:
•Y-axis Dark blue [1/h]: Net Output (1/h)
•Y-axis (2nd) Light blue line [units]: Gross Volume
•X-axis: Employee
Drillthrough:
HD Privacy Statement | Imprint | Prinect Know How