Operators ranking - map of production
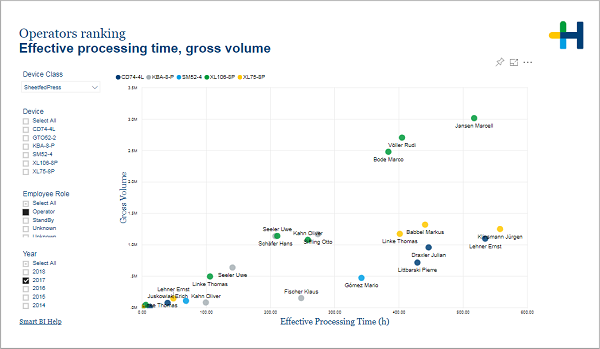
Operators ranking - map of production: Effective processing time, gross volume
(Change language of this page to: English, Deutsch)
This page presents Production values of Operators grouped by Devices. Helps to recognize Time utilization and Gross Production on different Devices.
Business questions
Goal:
Compare results in relation to others on the same devices.
Observations:
·Who is the leader of production?
·Is production proportional to utilization
Conclusions:
·Respect the most productive Operators.
·If differences in utilization are not planned, try to balance utilization
For fast overview of history use Tooltips mechanism to see all Operator’s results on different Devices or check the detailed history by Drillthrough mechanism.
Facts & Dimensions:
·Y-axis [units]: Gross Volume
·Dots: Employee
·Colors by: Device
·X-axis [h]: Effective Processing Time (h)
Drillthrough:
HD Privacy Statement | Imprint | Prinect Know How