•Net Productivity (1/h) and Net Output (1/h) by Year Month
•Net Output (1/h), Net Productivity (1/h) and Net Volume per Operation by Device
•Operating Time (h) by Device and Time type
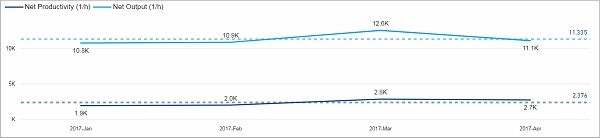
Net Productivity (1/h) and Net Output (1/h) by Year Month
For easier insight into history of Speed on Device the tooltips mechanism can be used – after moving mouse over a bar based on Device some additional information is presented: Net Output by Operators monthly.
Additionally, it is possible to go to Device details by using drillthrough mechanism.
Facts & Dimensions:
•Y-axis Dark blue line [1/h]: Net Productivity (1/h)
•Y-axis Light blue line [1/h]: Net Output (1/h)
•X-axis [date]: Year Month
•Drill Down => X-axis [date]: ISO Week
Net Output (1/h), Net Productivity (1/h) and Net Volume per Operation by Device
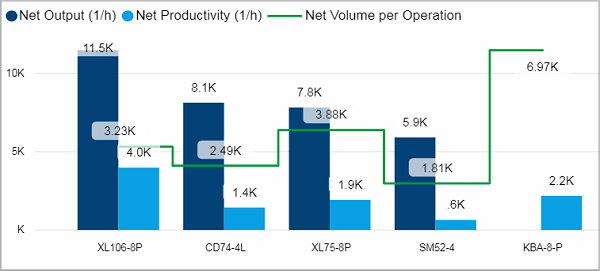
Facts & Dimensions:
•Y-axis Dark blue [1/h]: Net Output (1/h)
•Y-axis Light blue [1/h]: Net Productivity (1/h)
•Y-axis (2nd) Green line [units]: Net Volume per Operation
•X-axis: Device
Drillthrough:
Operating Time (h) by Device and Time type
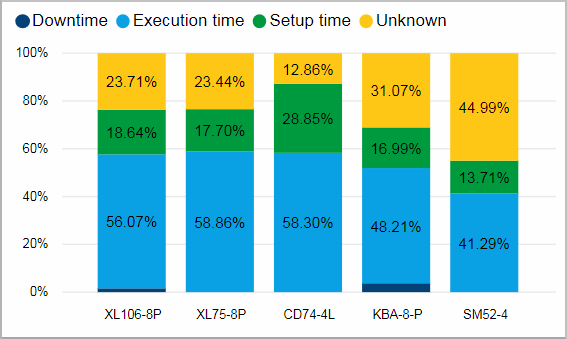
Moving mouse over Time type usage Tooltips present monthly run of Operating time divided into Time types.
Facts & Dimensions:
•Y-axis [%]: Operating Time (h)
•Colors by: Time type
•X-axis: Device
Drillthrough:
HD Privacy Statement | Imprint | Prinect Know How