Map of utilization of devices - Do the most effective devices work maximum time?
(Change language of this page to: English, Deutsch)
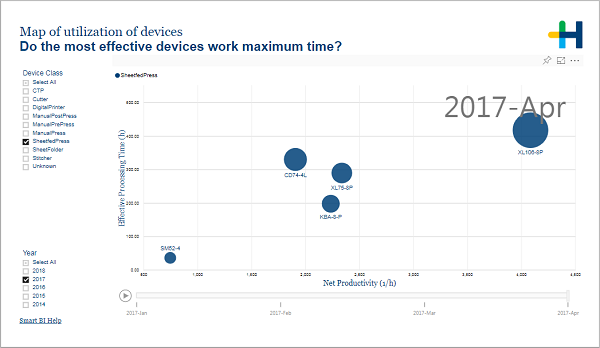
This page helps to compare Net Productivity (speed during Operating time) between Devices and the time spent on processing jobs. Net Productivity includes a big component of organizational effectiveness – on one side it is the crucial factor for planning long term abilities for production, on the other side it shows losses of time in comparison to nominal Speed.
By clicking on bubble the “route through months” is shown to evaluate dispersion of parameters:
For observing changes in time for all Devices use Play button.
Finally, it is possible to see Device details by drillthrough.
Facts & Dimensions:
•Y-axis [h]: Effective Processing Time (h)
•Dots: Device
•Colors by: Device Class
•Size by: Operation Count
•X-axis [1/h]: Net Productivity (1/h)
•Tooltip: Gross Volume
•Play Animation by: Year Month
Drillthrough:
HD Privacy Statement | Imprint | Prinect Know How