•Net Productivity (1/h) by Device and Year
•Net Productivity (1/h) by Year Month and Device
•Net Output (1/h) by Device and Year
•Net Output (1/h) by Year Month and Device
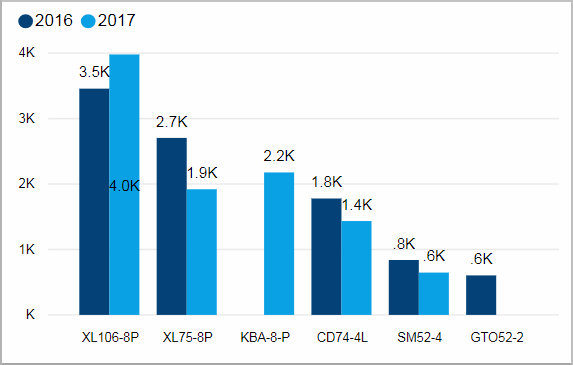
Net Productivity (1/h) by Device and Year
For fast evaluation of the results of Operators use Tooltips mechanism – move mouse over the bar on year to year chart to check members of team and their results.
Facts & Dimensions:
•Y-axis [1/h]: Net Productivity (1/h)
•Colors by: Year
•X-axis: Device
Drillthrough:
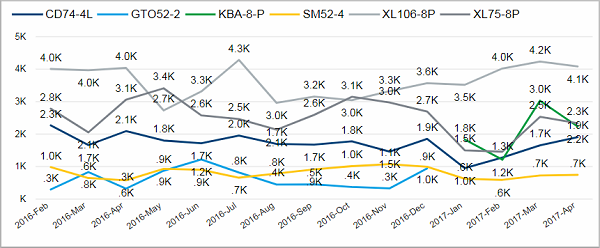
Net Productivity (1/h) by Year Month and Device
Facts & Dimensions:
•Y-axis [1/h]: Net Productivity (1/h)
•Colors by: Device
•X-axis [date]: Year Month
Drillthrough:
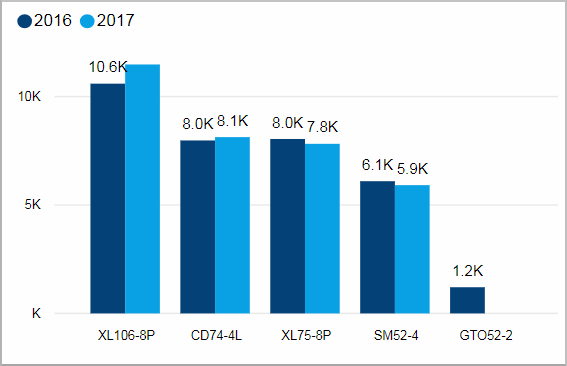
Net Output (1/h) by Device and Year
Facts & Dimensions:
•Y-axis [1/h]: Net Output (1/h)
•Colors by: Year
•X-axis: Device
For fast evaluation of the results of Operators use Tooltips mechanism – move mouse over the bar on year to year chart to check members of team and their results.
Drillthrough:
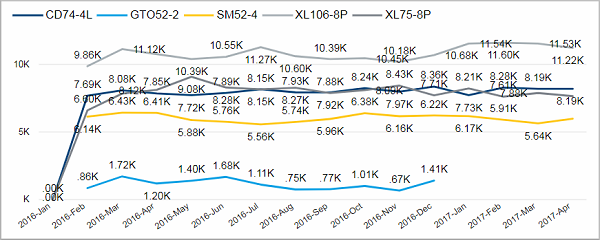
Net Output (1/h) by Year Month and Device
Facts & Dimensions:
•Y-axis [1/h]: Net Output (1/h)
•Colors by: Device
•X-axis [date]: Year Month
Drillthrough:
HD Privacy Statement | Imprint | Prinect Know How