Labelfire Primefire
Prinect Color Center gives you the option of viewing the results of quality control not only in the Color Center but also printing them in a PDF file.
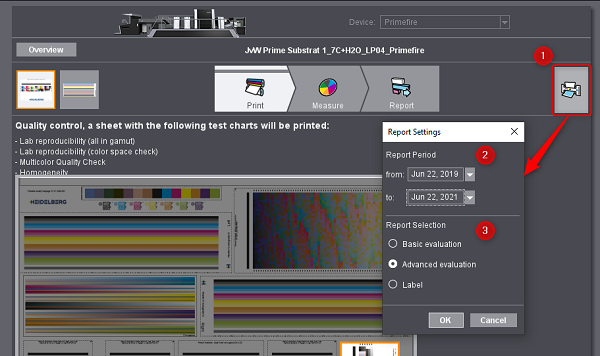
Click the "Print Quality Report" button [1]. A dialog displays where you can enter the settings for the report.
In "Report Period" [2], you can set which measurements will be included in the report. In "Report Selection", you can select how detailed the report will be and whether it will be output as a label via a connected device..
A print preview opens when you select "Basic evaluation" or "Advanced evaluation":
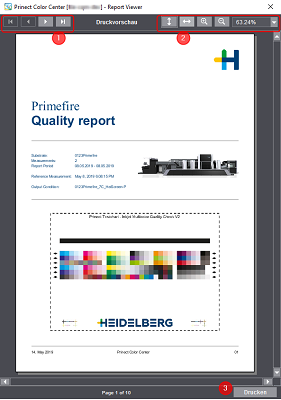
You can click through the pages of the report with the buttons [1]. You can resize the view with the buttons [2].
Click "Print" [3]. A dialog for selecting the printer opens. If you wish to have the report as a PDF file, select a virtual printer in this dialog that makes it possible to print to a PDF.
The simple report consists of the following pages:
•Data table - Simple evaluation
The advanced report also offers:
•Data table - Advanced evaluation: Machine stability / process stability
•Data table - Advanced evaluation: Setpoint attainability (Primefire only)
•Diagrams on machine stability
•Diagrams on process stability
•Diagrams on setpoint attainability (Primefire only)
The title page of the report shows the name and an image of the press used. The following data are found next to it:
•The name of the substrate
•The number of check measurements
•The period in which the measurements were run
•The date of the reference measurement to which the check measurements refer
•The name of the output condition
The test chart for quality control displays below that.
Set company logo
It is possible to replace the Heidelberg logo with a company logo. To do this, the logo must be saved as a PNG file named "CompanyLogo.png" in the installation folder: C:\Program Files\Heidelberg\Prinect ColorCenter\.
The dimensions and resolution of the image do not have to be taken into account because the logo is automatically scaled in the report.
If there is no "CompanyLogo.png" file, the Heidelberg logo will be used instead.
Data table - Simple evaluation
The table lists all check measurements that were run and indicates by means of a symbol whether the values for machine stability and process stability as well as for setpoint attainability were within the tolerance range.
Data table - Advanced evaluation: Machine stability / process stability
This table also has details about machine stability and process stability. See also Table.
Data table - Advanced evaluation: Setpoint attainability
This table also has details about setpoint attainability. See also Table.
There are a total of three diagrams for showing machine stability: for the tonal values of 40%, 70% and 100%. For the tonal values of 40% and 70%, the tonal value deviations display in %, and in the case of solid tints, the ΔE00 deviation from the reference measurement displays. The solid tint diagram also has the values for paper white.
In addition to the diagrams, the color patches that are incorporated into the evaluation are marked on the test chart.
Process stability can be evaluated using the ΔE00 deviation (from the reference values) determined via various color patches and through the 95% quantile. The 95% quantile is the ΔE00 value below which 95% of all measured data are found.
Diagrams on setpoint attainability
There are four diagrams for evaluating setpoint attainability: Like in process stability, a diagram on the Lab mean and the 95% quantile, with the deviation from the Lab setpoints and not from the reference measurement being viewed in this case. In addition, there is also a diagram on gray balance and on the ΔE00 deviation of the substrate compared to the reference sheet paper white.
This page gives you an overview of the limits that are applicable for grading into one of the four tolerance classes ("A" thru "D").