Measure - Check compliance with process standard
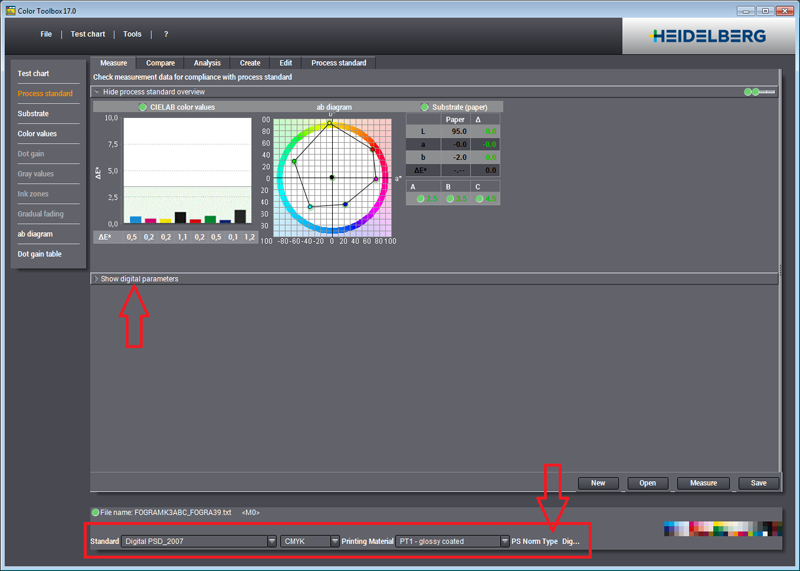
All checks are available in "Measure", parameters are set up in the "Process standard" tab. The status bar also indicates the type of the selected process standard.
Every PSO type has a tab of its own. Settings for color values and printing materials are identical for all types.
A digital process standard is selected in the current example. For this reason, only the digital printing tab is operable while all other types are disabled and closed. The common part in the upper section matches the selected type. As digital printing has three quality levels, the printing material element shows three results.
Proof and digital printing process standards require an internal reference file for calibration. For coated printing materials (paper types 1 and 2 and — with a future process standard — PS1), this internal reference is usually the FOGRA39L file describing the ISO12647-2 (or IT8.7/4) test chart.
The internal reference for uncoated printing materials is the FOGRA47L file.
Check measurement data for compliance with process standard
This diagram lets you check whether the measured data are within the tolerances of a selected process standard. The process standard can be a default one (ISO 12647-2 process check) or a user-defined one.
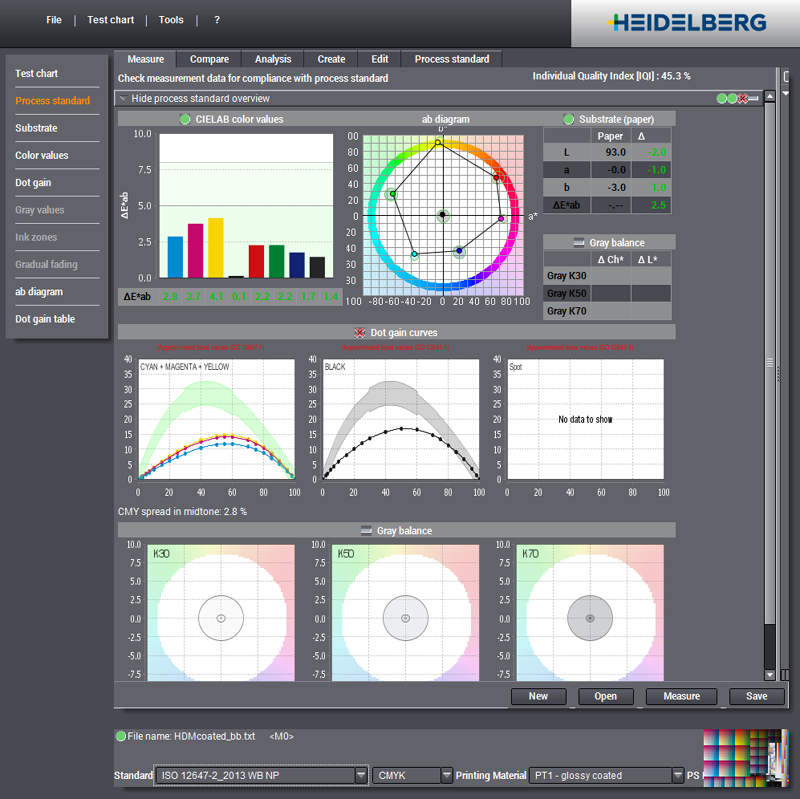
Hide/Show process standard overview
The overview has as many as nine views and can be minimized to a caption bar. You can show or hide the overview by clicking this line.
The result of the check is indicated by the following symbols on the right of the caption bar:
|
|
No values available |
|
|
All the values are in the tolerance range. |
|
|
Several values are not in the tolerance range. |
The appraisal refers to all defined process colors (CMYK, multicolor or spot colors) and is shown in the relevant color with color name (if there is one) and curves or bar graphs.
The following views display in the overview:
•CIELab color values: ΔE bars and table for the primary and secondary colors and for three-color gray (Overprint)
•ab diagram: View of the CIELAB color values on the ab plane
•Substrate (paper white): View of the Lab values and their differential value "Δ" for paper white
•Dot gain curves: View showing values in steps of 10% and for 25% and 75%, if present
·CMYK: separately for CMY and K
·Multicolor: all defined process colors (CMYK and red (orange), green and/or blue/purple)
·Spot Colors: all defined process colors

Note: The dot gain curves only display if spectral values and/or density values were measured in addition to the color data (see "Preferences > Measurement").
•Gray balance (table): View of the chroma differential values "ΔCh" and the lightness differential values "ΔL" for three gray values "K30", "K50" and "K70" (quarter tone, midtone and three-quarter tone) or for "K25", "K50" and "K75"
•Gray balance (diagram): View of the gray balance in the ab diagram for the three gray values (quarter tone, midtone and three-quarter tone)
You can also print the views as logs ("Diagrams to be printed > Process standard").


