Evaluation of Image Control Data
As of version S22A_IC, the Quality Report replaces the Quality Monitor in Image Control. When Image Control is connected to Color Toolbox, you can continue using the full scope of Quality Monitor functions and have additional view options for a more detailed quality assessment. You can also use the new function for analyzing measured data.
After establishing the connection to the folder where Image Control saves the color data (in Image Control: “Integration/System > Prinect Configuration > Analyze Point”), this data, Color Toolbox can display this data in an extended display for Image Control files.
You can toggle between all machines that write their data to this folder when the job is released, and between the jobs and within the jobs between the sheets.
The evaluation options "Measure" and "Compare" of Color Toolbox are thus also available for Image Control:
•Determine whether the job data is in the required process standard or within the permitted tolerance range (see Analyses in the "Measure" Tab)
•Compare the current job with previous jobs that were printed on the same or on another press (see Comparing different data ("Compare" tab))
•Compare the individual sheets of a job or different control elements
In this way, the Color Toolbox can be used to monitor the printing process. Different procedures let you check and record the quality of this process in a systematic and simple manner.
The measured data required for this are recorded using defined test equipment. The spectrophotometric measurements obtained with Image Control are available for simple and direct use.
The quality evaluations are based on the ISO process standards and on the comparison of these with pre-stored or custom standards. In addition to the evaluations known from the Image Control Quality Monitor, evaluations based on color measurement data records of defined test charts and control elements (e.g. ISO 12642/ANSI IT8.7, ECI 2002, CGATS, HDM, Ugra/FOGRA) are also possible.
Test strips in the printable but non-usable area are also printed during output to a press. The strips are then measured and compared with the process defaults. This lets you check whether the printing process complies with the process standard.
Quality characteristic values, e.g. statistical parameters from ΔE evaluations, are calculated by comparing color data sets.
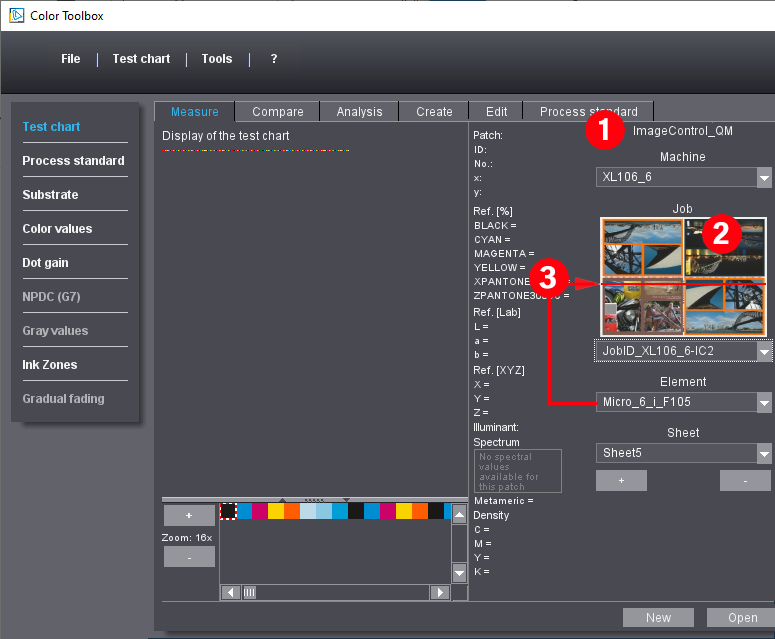
Overview of the Image Control UI Extension
In the area to the right, you see the view extended for Image Control (1).
A preview image provided by Image Control 4 (as of version S22A_IC) is displayed above the list boxes. If there is no preview or if the data was created with Image Control 2 or 3, the preview is a gray rectangle in sheet size. (2)
The position of the selected measurement element is displayed as a red bar in the preview image (or green in the reference image), similar to the internal Quality Monitor of Image Control. (3)
The list boxes are structured hierarchically, which means that you first select the press in the upper list box and then the job printed on this press. All control elements used in the job and, where applicable, several sheets of the job display.
You can easily switch between the sheets of a job using the plus/minus buttons (4).