
You can view "Display of the ink zones", for example, if you evaluate the "Color Calibration Test Chart" with the appropriate control element (see Loading a Combined Test Chart). You can also use a test strip with information about the ink zones that has solid tint patches in each ink zone.
In this case, for example, the print control strips found on every press sheet are suitable for evaluation of the data.
This view lets you check the ink stability of a press sheet. The ink stability indicates whether ink is applied evenly in every ink zone.
A diagram of the ΔE values displays by default. You can select between the following view modes in the list box:
•Show density
•Show ΔE
•Show density table
•Show ΔE table
The standard curve (continuous line in the relevant color) and the tolerance range (green) of the process standard are shown when you view the curves. You can select the process standard that you wish to view in the "Process standard" main function. You can also change the tolerance range in this window, if it is necessary.
Note: You can set tolerances for the ink zones and gradual fading in the "Preferences > Tol [%]" dialog. These tolerances do not refer to the process standard when you assess density. This is where you define a threshold that refers to an evaluation diagram that displays for the single views (see Show density).
Each single view of the ΔE evaluation displays the process standard tolerance for the color you selected.
The graph shows the solid tint density curves for all defined color channels for the various ink zones. The tolerance ranges of the process standard are also shown in green for the four process colors black (DV BLACK), cyan (DV CYAN), magenta (DV MAGENTA) and yellow (DV YELLOW).
The ink zones used (position on the press sheet) are recorded on the horizontal axis and the measured solid tint densities on the vertical axis. The broken line indicates the mean in all the ink zones used for each color.
It is possible to view the solid tint density curves for a maximum of eight colors. However, the "Prinect_6S" and "Prinect_6S+" control strips let you check the density values for as many as twelve colors. "Prinect_6S" contains the first six defined colors, "Prinect_6S+" all other colors. The order of the colors depends on the setup of the printing units (e.g. in Image Control).
Click anywhere within a color channel to view this color with a scale range.
The maximum deviation from the mean is shown in percent for this channel to the right of the curve.
You can set tolerances for the ink zones in the "Preferences > Tol [%]" dialog. By doing this, you define the limit up to which the maximum deviation from the mean can be accepted. This is indicated by a green area in the graphic. The red area indicates the part outside the set tolerance.
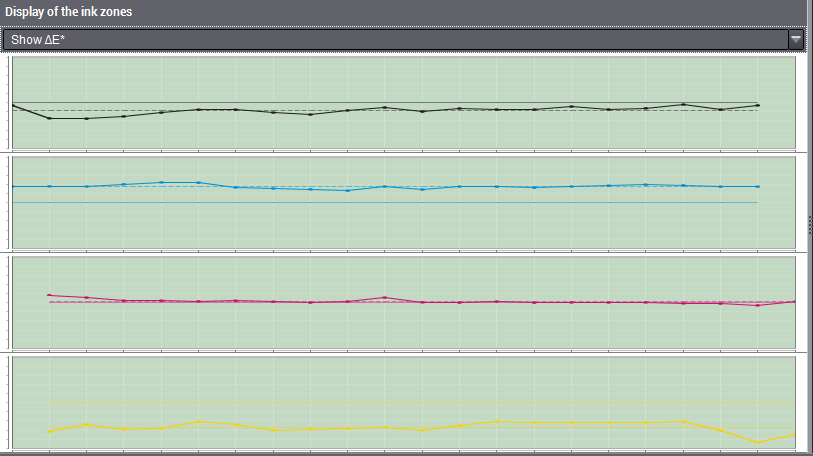
The graph shows the ΔE values for all defined color channels for the various ink zones.
Green indicates the tolerance ranges of the process standard for the four process colors black (ΔE BLACK), cyan (ΔE CYAN), magenta (ΔE MAGENTA) and yellow (ΔE YELLOW).
The ink zones used (position on the press sheet) are recorded on the horizontal axis and the calculated ΔE values on the vertical axis. The broken line indicates the mean in all the ink zones used for each color.
It is possible to view the ΔE values for a maximum of eight colors. However, the "Prinect_6S" and "Prinect_6S+" control strips let you check the ΔE values for as many as twelve colors. "Prinect_6S" contains the first six defined colors, "Prinect_6S+" all other colors. The order of the colors depends on the setup of the printing units (e.g. in Image Control).
Click anywhere within a color channel to view this color with a scale range.
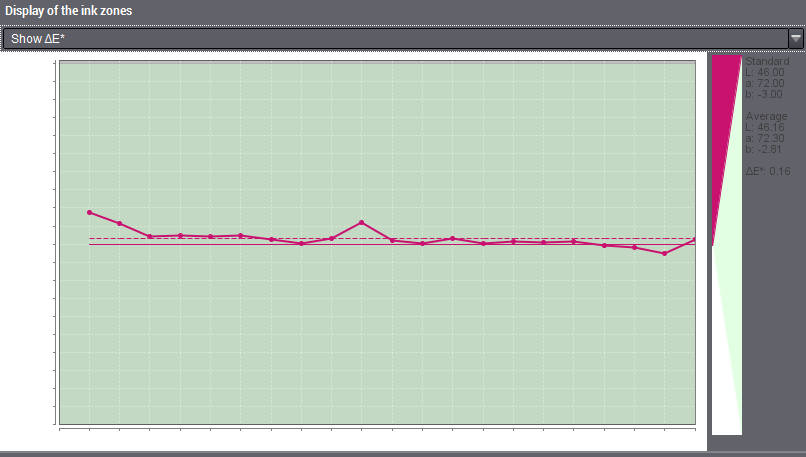
Example: ΔE values shown for magenta
The Lab values of the process standard you selected and the mean values (Average) calculated from the actual Lab values are shown to the right of the curve. Light green indicates the tolerance of the process standard.
The table lists all available solid tint density values of the defined color channels for each zone that is taken into account. The deviation from the mean is also shown in each case. You can use the scroll bar to move the part that you can view up or down.
The table lists all available ΔE values of the process colors (cyan, magenta, yellow and black) for each zone that is taken into account. The deviation from the mean is also shown in each case. You can use the scroll bar to move the part that you can view up or down.