In the view mode, select the process standard you want in the "Standard" and/or "Printing Material" lists. The following data displays in diagrams and data tables when you click the respective caption: L*a*b* values for paper white, dot gain, nominal values and tolerances of CIELab data plus any density values and the order of printing.
Default
You select the standard from two list boxes:
•In the left list box, select the type of printing process ("CMYK", "Multicolor" or "Spot colors").
•In the right list box you select the name of an existing process standard.
Some of the shipped process standards are defined for a number of printing materials and you can select the ones you want in the "Printing Material" list.
Printing material
The various printing materials have different color data and tolerances. The following paper grades are defined for the Color Toolbox:
•PT1 - gloss coated white
•PT4 - uncoated white
Comment
The process standards included in the shipment have more details about the name in a comment (e.g. details about the basis, backing, the defined printing materials) if you need more information. This comment appears as a tooltip in the tree structure of "Administration" and helps you decide which process standard is the one you need.
PS Norm Type, Delta E Type and Density status
These list boxes are active only in the edit mode (see 'Overview - Edit (Edit mode)).
Internal reference file
This box is active only in the edit mode (see 'Overview - Edit (Edit mode)).
Show/Hide Dot Gain Curves
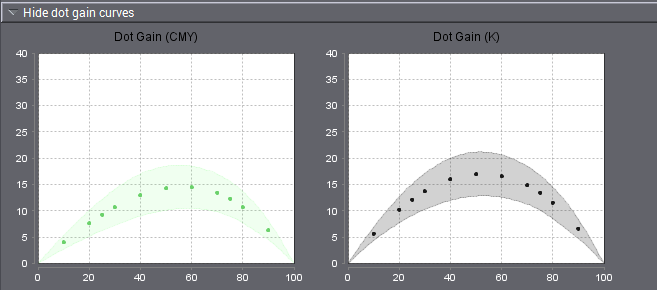
The dot gain is shown in a diagram in the view mode. In Color Toolbox you can determine the dot gain in steps of 10% and also for the two reference points 25% and 75%.
When you create and save process standards locally, the curves for the three chromatic process colors Cyan, Magenta and Yellow (primary colors) are shown together. Black (K) is shown separately because it usually has higher deviating defaults. The small dots you see in the diagrams show you where the dot gain was determined.
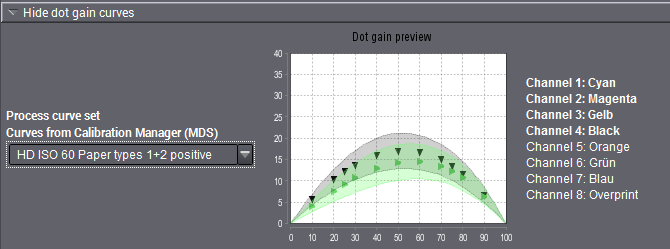
When you import dot gain from Calibration Tool, all the colors will appear in a single diagram. Click the graphic area to switch to single views of colors or to go to the next curve. The corresponding color channels are shown to the right of the diagram. These are generally the HD-ISO curves.
Show/hide dot gain values
The dot gain value table shows the nominal values and tolerances for dot gain specified in the process standard in black; non-existing values are shown in gray.
A color sample at the upper table edge shows the process colors.
•Std = defined dot gain of the process standard
•Tol = tolerance value
The spread is calculated without black as the dot gain tolerances for the three chromatic colors cyan, magenta and yellow are generally different from the tolerance for black. The spread is the maximum difference between the three chromatic process colors. This is the maximum spacing between the curves in the graph. An additional limit is evaluated with the spread. This means that the actual values are not in the process standard when this value is exceeded, even if the values are within the tolerance range.
Show/hide paper white
Paper white is shown separately because the tolerances for the L*, a* and b* values usually differ.
The tolerances relating to the process standard are indicated separately in the table to the right as Δ values.
You can hide and show this view as you like.
"Show/Hide CIELab color values and density values
In the data tables, the nominal values and tolerances of the CIELab values (solid tint) specified in the process standard are black if they are enabled and gray if disabled.
The tolerance is specified by the color difference ΔE* (color distance).

Note: The present default values for secondary colors and overprint (CMY Gray) are disabled for older process standards because they are difficult to comply with technically.
The process standards included in the shipment are write-protected. You must save the process standards under a different name if you wish to enable the values for secondary colors, overprint and, if necessary, density.
You can also view the final density values for the primary colors cyan, magenta, yellow and for black on the right side if the relevant boxes are checked.

Note: Although all the process standards shipped with the Color Toolbox have solid tint density values, these values are disabled. This is because it is very difficult to specify density defaults due to varying measurement conditions.
ISO standards do not have any binding density defaults because this parameter is not standardized and explicit.
You can enable these density values by checking the boxes in the edit mode. These default density values correspond to measurement conditions with a polarization filter.
Show/Hide gray balance parameters
In "Gray balance parameters" you can define the tolerance for the gray balance check within the process standard check. The sampling points are K30, K50 and K70.

Note: Up to now, the gray balance parameters were set and displayed in "Preferences" > "Individual Quality Index [IQI]" tab. Because they are part of the offset process standard, they are now set and displayed from a central point in this view.
Show/hide print order
The order of printing defined for the process standard is shown by a press with a maximum of eight printing units. Active printing units are numbered from right to left and marked by the respective colors.

Note: The "Use measurement values" function is not available in the view mode.