
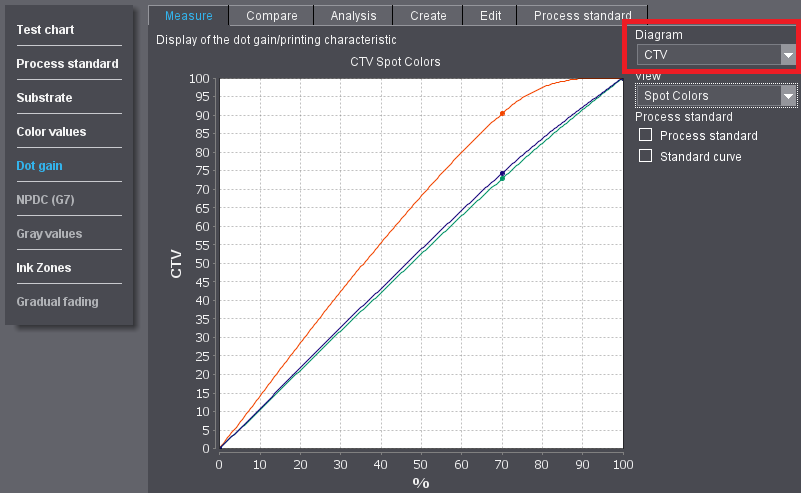
The dot gain curves of the printing process (process colors, mixed colors and/or spot colors) are shown in the diagram. You can also toggle the view to display the printing characteristics or CTV (see CTV). You can also view the related data table.
The dot gain curves or printing characteristics are calculated on the basis of real density values if you also measured the density when measuring the colors (selected in the "Preferences" dialog).
If you don't, the density values are calculated from the spectral values or, if the latter were also not measured, by general approximation from the Lab(xyz) values.
Note: The heading above the graph indicates how the tonal values or printing characteristic were determined:
•"Display of the dot gain curve/printing characteristic (Measured density values)" if you have density values.
•"Display of the dot gain curve/printing characteristic (Approximated tonal values ISO 12647-1)" in red if density values are calculated.
Diagram
You can select the type of diagram you want to the right of the diagram:
•Dot gain: Display of the dot gain curves
•Printing Characteristic: Display of the printing characteristic
•CTV: Dot gain representation, calculated as per ISO 20654
The dots shown are the measured values that are used to determine the dot gain.
You select the curves that you want to view in "View".
Display
In the list box, select the colors of the curves that will be shown.
The curves can be displayed together or separately. The number of colors depends on the data file you selected. The Color Toolbox supports the import and export of eight color channels. The color names are taken from the color data file.

Note: When you save your quality data in Image Control, the color names are used for the setup of the printing units. It is possible that the same color name is used because of the automatic assignment of the different hues. If necessary, you can change these names (in Image Control).
It is possible to view the dot gain curves or printing characteristic for a maximum of eight colors. However, the "Prinect_6S" and "Prinect_6S+" control strips let you check the dot gain for as many as twelve colors. "Prinect_6S" contains the first six defined colors, "Prinect_6S+" all other colors. The order of the colors depends on the setup of the printing units in Image Control and it can be changed there.
A table is hidden below the graph. View this by dragging the horizontal bar upwards with the mouse. This makes the curve diagram smaller (see Data Table).
You can print the curve diagram and its data table as a log (see General Information about Printing).
You can also just print or save the curves or zoom in or out of parts of the diagram (see Context-sensitive Menu).
Process standard
You can also display the tolerance range and/or standard curve of the process standard for cyan, magenta, yellow and black by checking the appropriate box when viewing these four process colors separately. You can also view the three chromatic process colors (CMY) jointly.
"Spot colors" also displays in "View" if you selected a spot color or multicolor process standard.
•Process standard Display of the tolerance range for the current process standard by a green area above or below the dot gain curves. Optimally, the curves should be in the middle of the tolerance range.
•Standard curve: Display of a green curve defined for the process standard if the single process colors (cyan, magenta, yellow or black) or joint CMY are selected.

Note: You can replace the process standard you are currently using by selecting a different one in the "Process standard" main function.
Dot gain is the enlargement of screen dots by the printing process. An image can thus appear darker and/or a color shift may occur.
Normally, dot gain is measured in the midtones at 40% and in the shadows at 80%.
Printing characteristic is used to illustrate in screen percent the relation of the dot areas in print to those on the film or in the data set. The ideal printing characteristic is linear and rises at an angle of 45°.
The printing characteristic depends on the ink used, the properties of the paper, the print form and the way the press works.
The printing characteristics that are determined only apply to the process conditions at hand. If the same data are to be produced on a different press or on different printing stock, the printing characteristics will also change.
Density and the resulting dot gain increases are suitable measures for the four-color process, as corresponding color filters are defined. The increasing use of spot colors, especially in packaging printing, requires alternative dot gain calculations, also based purely on L*a*b*, as specified in ISO 20654. These then show a more linear dot gain gradation.
You can view the data table if you drag the horizontal bar below the curve diagram upwards. This makes the curve diagram smaller. All the colors are always shown in the data table, irrespective of the curve you select in the "View" list. If necessary, you can move the visible section using the scroll bars.
The table displays the following values, separately for the four process colors:
•dot gain (%)
•deviation from the process standard (Δ)
The dot gain is shown for all other colors. All the dot areas (%) in the test chart or control element are taken into account. Values that are not defined in the process standard are calculated from the curves.
You have the following additional functions through the context-sensitive menu (generally right-click) in curve diagrams:
•"Save As": to save the graphic as a PNG file (*.png, Portable Network Graphics). This format is suitable for viewing the graphic on a website, supports a color depth of 24 bits and uses a lossless method of compression.
•"Print": opens the normal Windows print dialog with page and printer settings for printing the graphic.
•"Zoom in": to scale up a curve section in the graphic either in horizontal or vertical direction or symmetrically in both directions.
•"Zoom out": to scale down a curve section in the graphic either in horizontal or vertical direction or symmetrically in both directions.
•"Auto Range": to reset the zoom functions, either in horizontal or vertical direction or symmetrically in both directions.